
HARBOR Winter Particulate Study 2016 Results (updated 16 Jan 2017)
The Final Report to UDAQ is in the form of an executive summary and includes details about the instrumentation and measurement protocols for flight. Important Note about the Final Report. The writing content is solid, but the graphics are continually getting updated. Those data updates are only in this "live" webpage below.
Updates 16 January 2017: The plots had all their axes corrected to be the same scale for all plots of a particular type. It is now much easier to compare between days and between flights. On the other hand, details are harder to pick out from these overview plots.
Data Overview:
Table I. Flight
and Data Summary
|
Date |
Number of Flights |
Notes |
|
Feb
6, Saturday |
3 |
Winds
generally from the SW. |
|
Feb
9, Tuesday |
10 |
Winds
generally from the WNW. |
|
Feb
11, Thursday |
4 |
Winds
generally from the NW. |
|
Feb
13, Saturday |
13 |
Winds
generally from the NW. |
|
Feb
15, Monday (Presidents’ Day) |
10 |
Winds
started from the SE gradually changing to the WNW. |
Click on images for the full size version. The links to the "full data sets" will bring you to directories with the data in both raw format and as semi-processed Excel files. The Excel files are "live" and being changed as we get to it.
Notes on the "raw" data stored as .CSV files. The columns in these raw files are:
UTC Time, Altitude[m] ASL, O3[ppb], rawNO2[V], NO2[ppb], rawNH3[V], NH3[ppb], pm2.5[ug/m^3], 0.3[/L], 0.5[/L], 0.7[/L], 1.0[/L], 2.0[/L], 5.0[/L]
The UTC Time and Altitude data come from GPS.
The ozone [ppb] is measured using a standard NOAA accepted ozonesonde. The concentration is calculated using the most common of the accepted algorithms.
The NO2 and NH3 columns: the "raw" column is the voltage from the sensor as measured in the AtmoSniffer. The "ppb" column is known to be inaccurate. The general calibration should be OK, but there is a known zero-shift problem. These data should not be used as "accurate values" but only for trends.
The pm2.5 column is from a Sharp Microelectronics GP2Y1010AU0F module. It provides a voltage that is proportional to the particle count. The actual density that is reported is using an estimate of average particle size and density. This unit has been compared with multiple days' worth of data at the Ogden, UT, Utah Division of Air Quality air monitoring station and was shown to be in reasonable agreement. There was an intake filter in front of the sensor that removed all particulates larger than 2.5 microns in diameter. Thus, this data column is for all particles smaller than or equal to 2.5 microns.
The "0.3" through "5.0" columns are pure particle counts per liter of air. No attempts at determining density were done. These data were collected using a Met One Instruments, Inc., GT-526 six-channel laser backscatter handheld particle counter. It was factory calibrated and refurbished a few months prior to the start of the Winter PM Study. These columns are "inclusive" of the larger data. That is, column 0.5 [L] contains counts for all particles 0.5 microns in diameter and larger to the limit of what would go through the intake tube (there was no filter, so even dust would be counted). Thus, to determine how many particles were counted between the size of 0.7 microns and 1.0 microns, for example, you would need to subtract the larger column from the smaller column.
Finally, other (uncalibrated) gas data are available for SO2 and CO for these flights in the raw HARBOR flight data. There is also complete data from the onboard inertial measurement system including 6-axis accelerometer data, 3-axis gyroscope data, and 3-axis magnetic field data. These data along with the complete GPS data on latitude, longitude, and altitude could be used for studies on turbulence and/or local wind loading. Please contact us if you would like assistance with such a project or need more information.
The Winter PM Study 2016 WSU HARBOR Vertical Column Dataset:
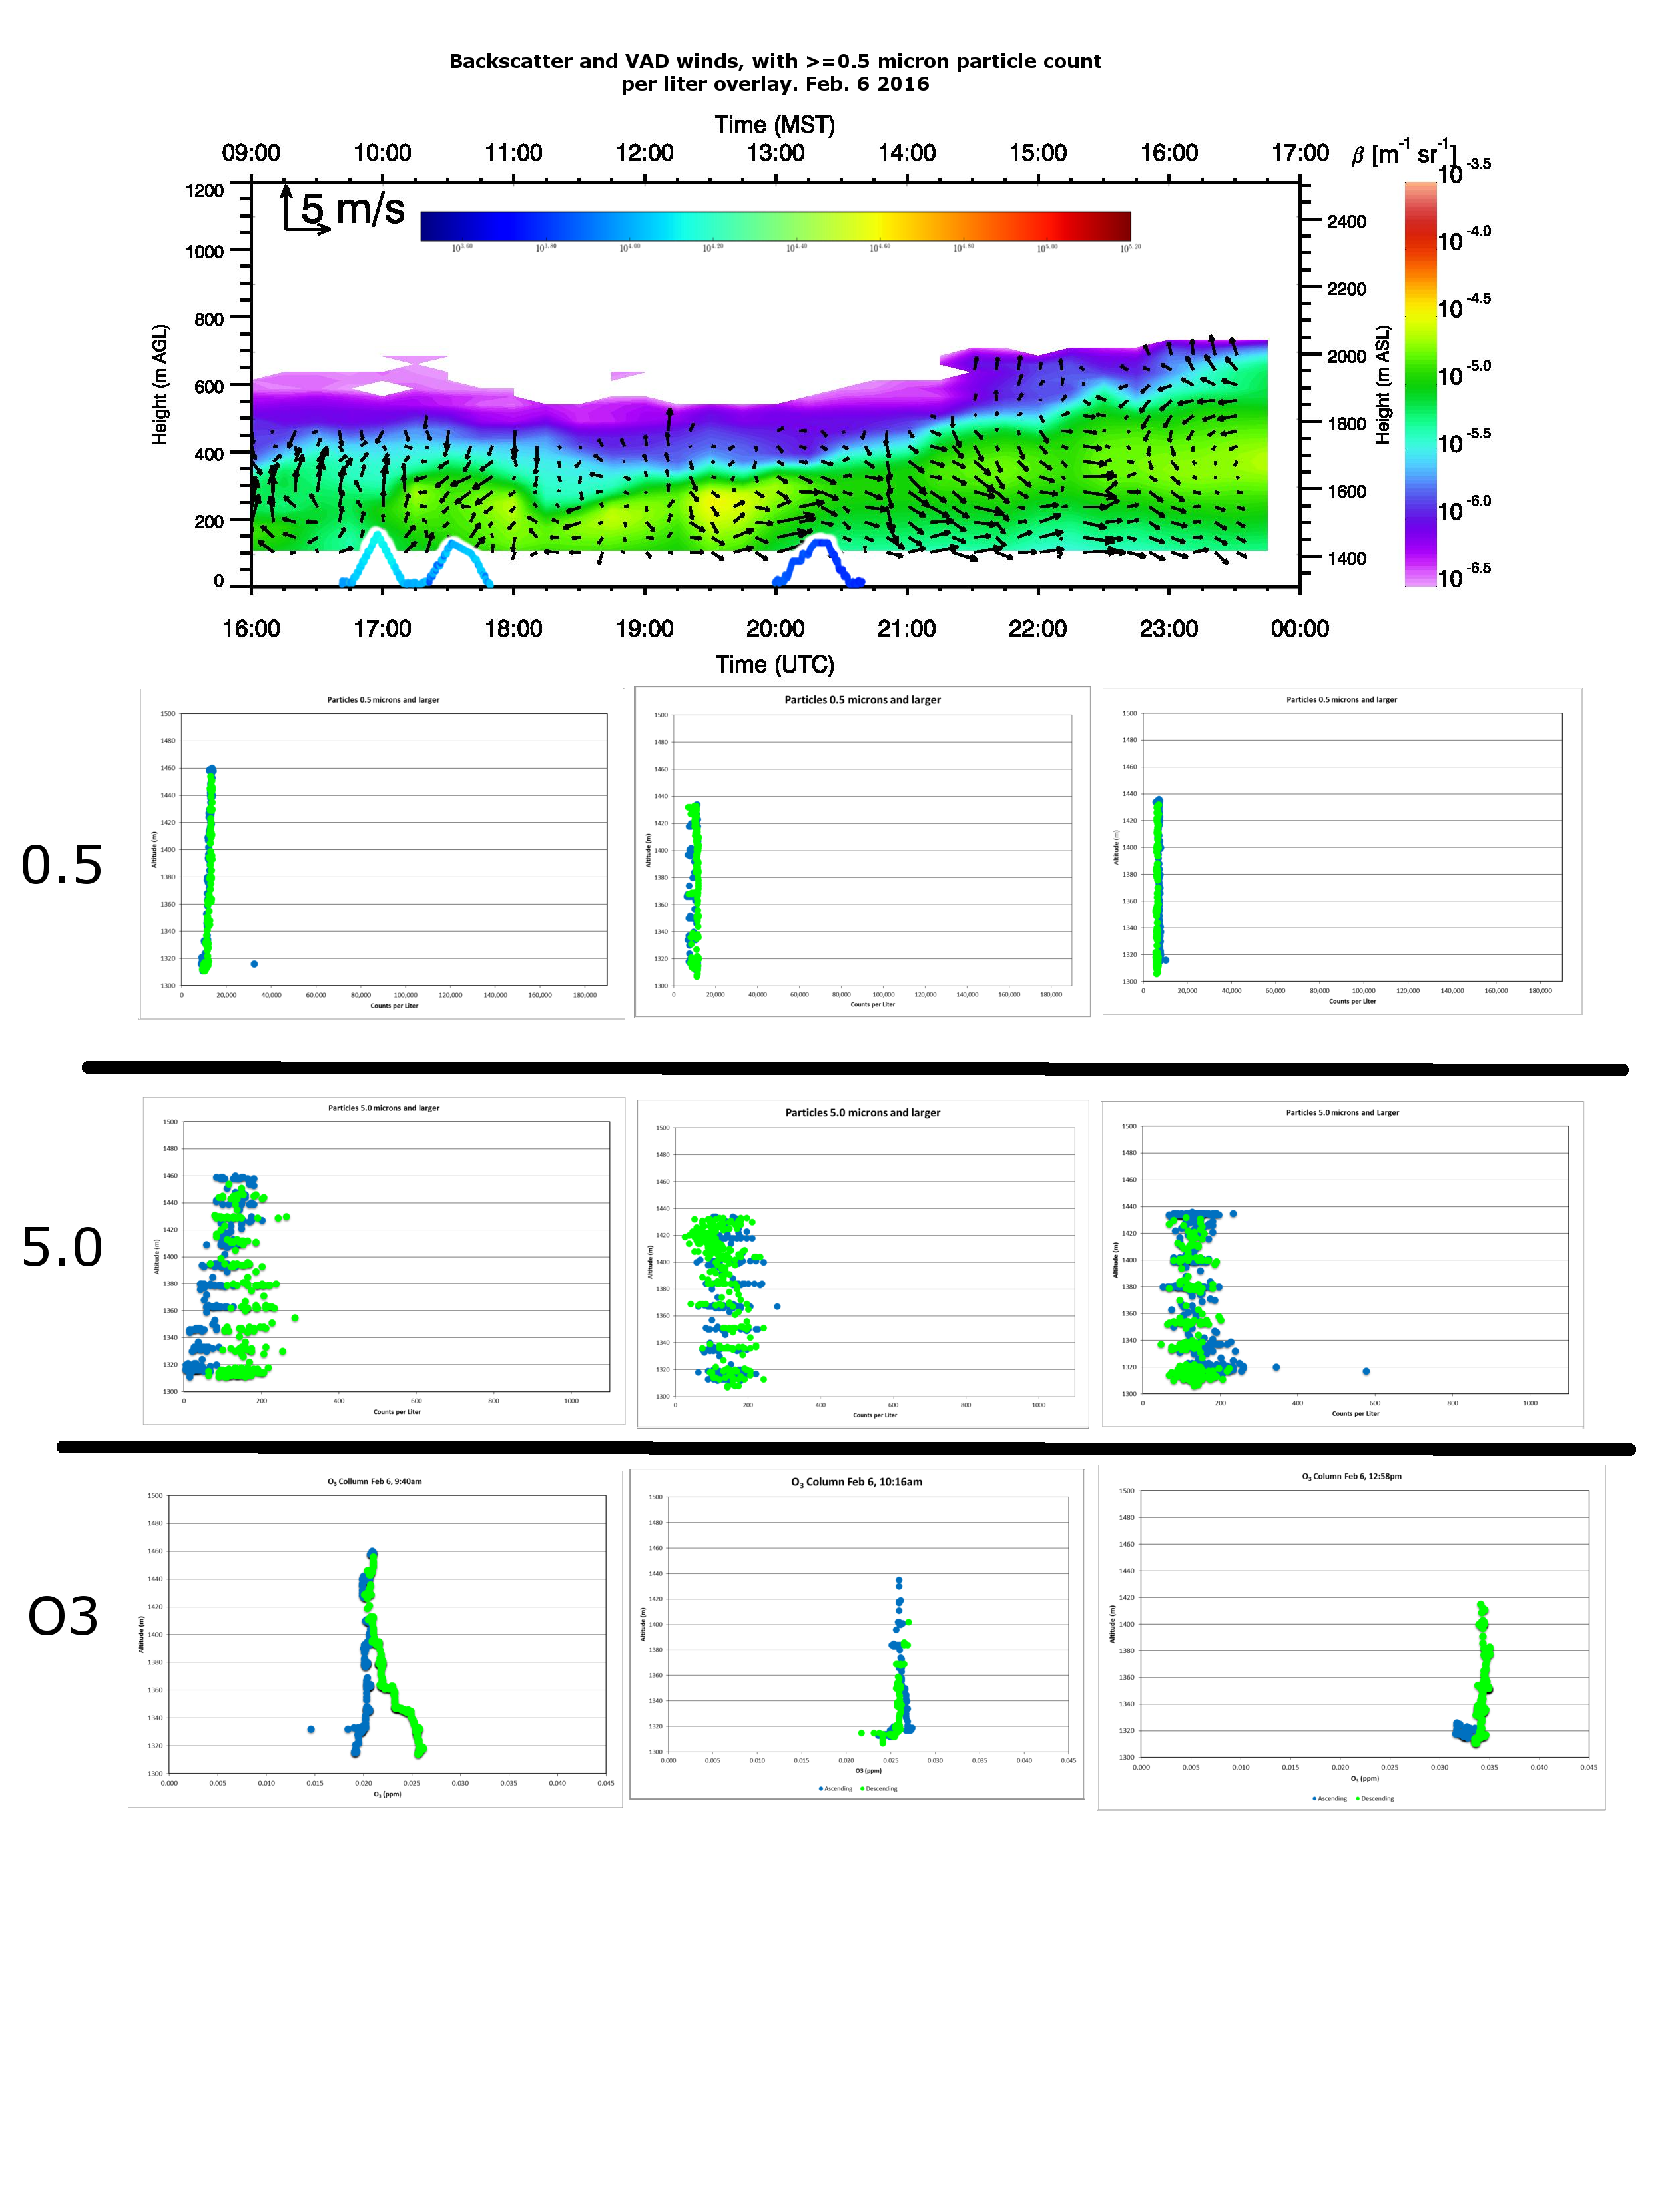
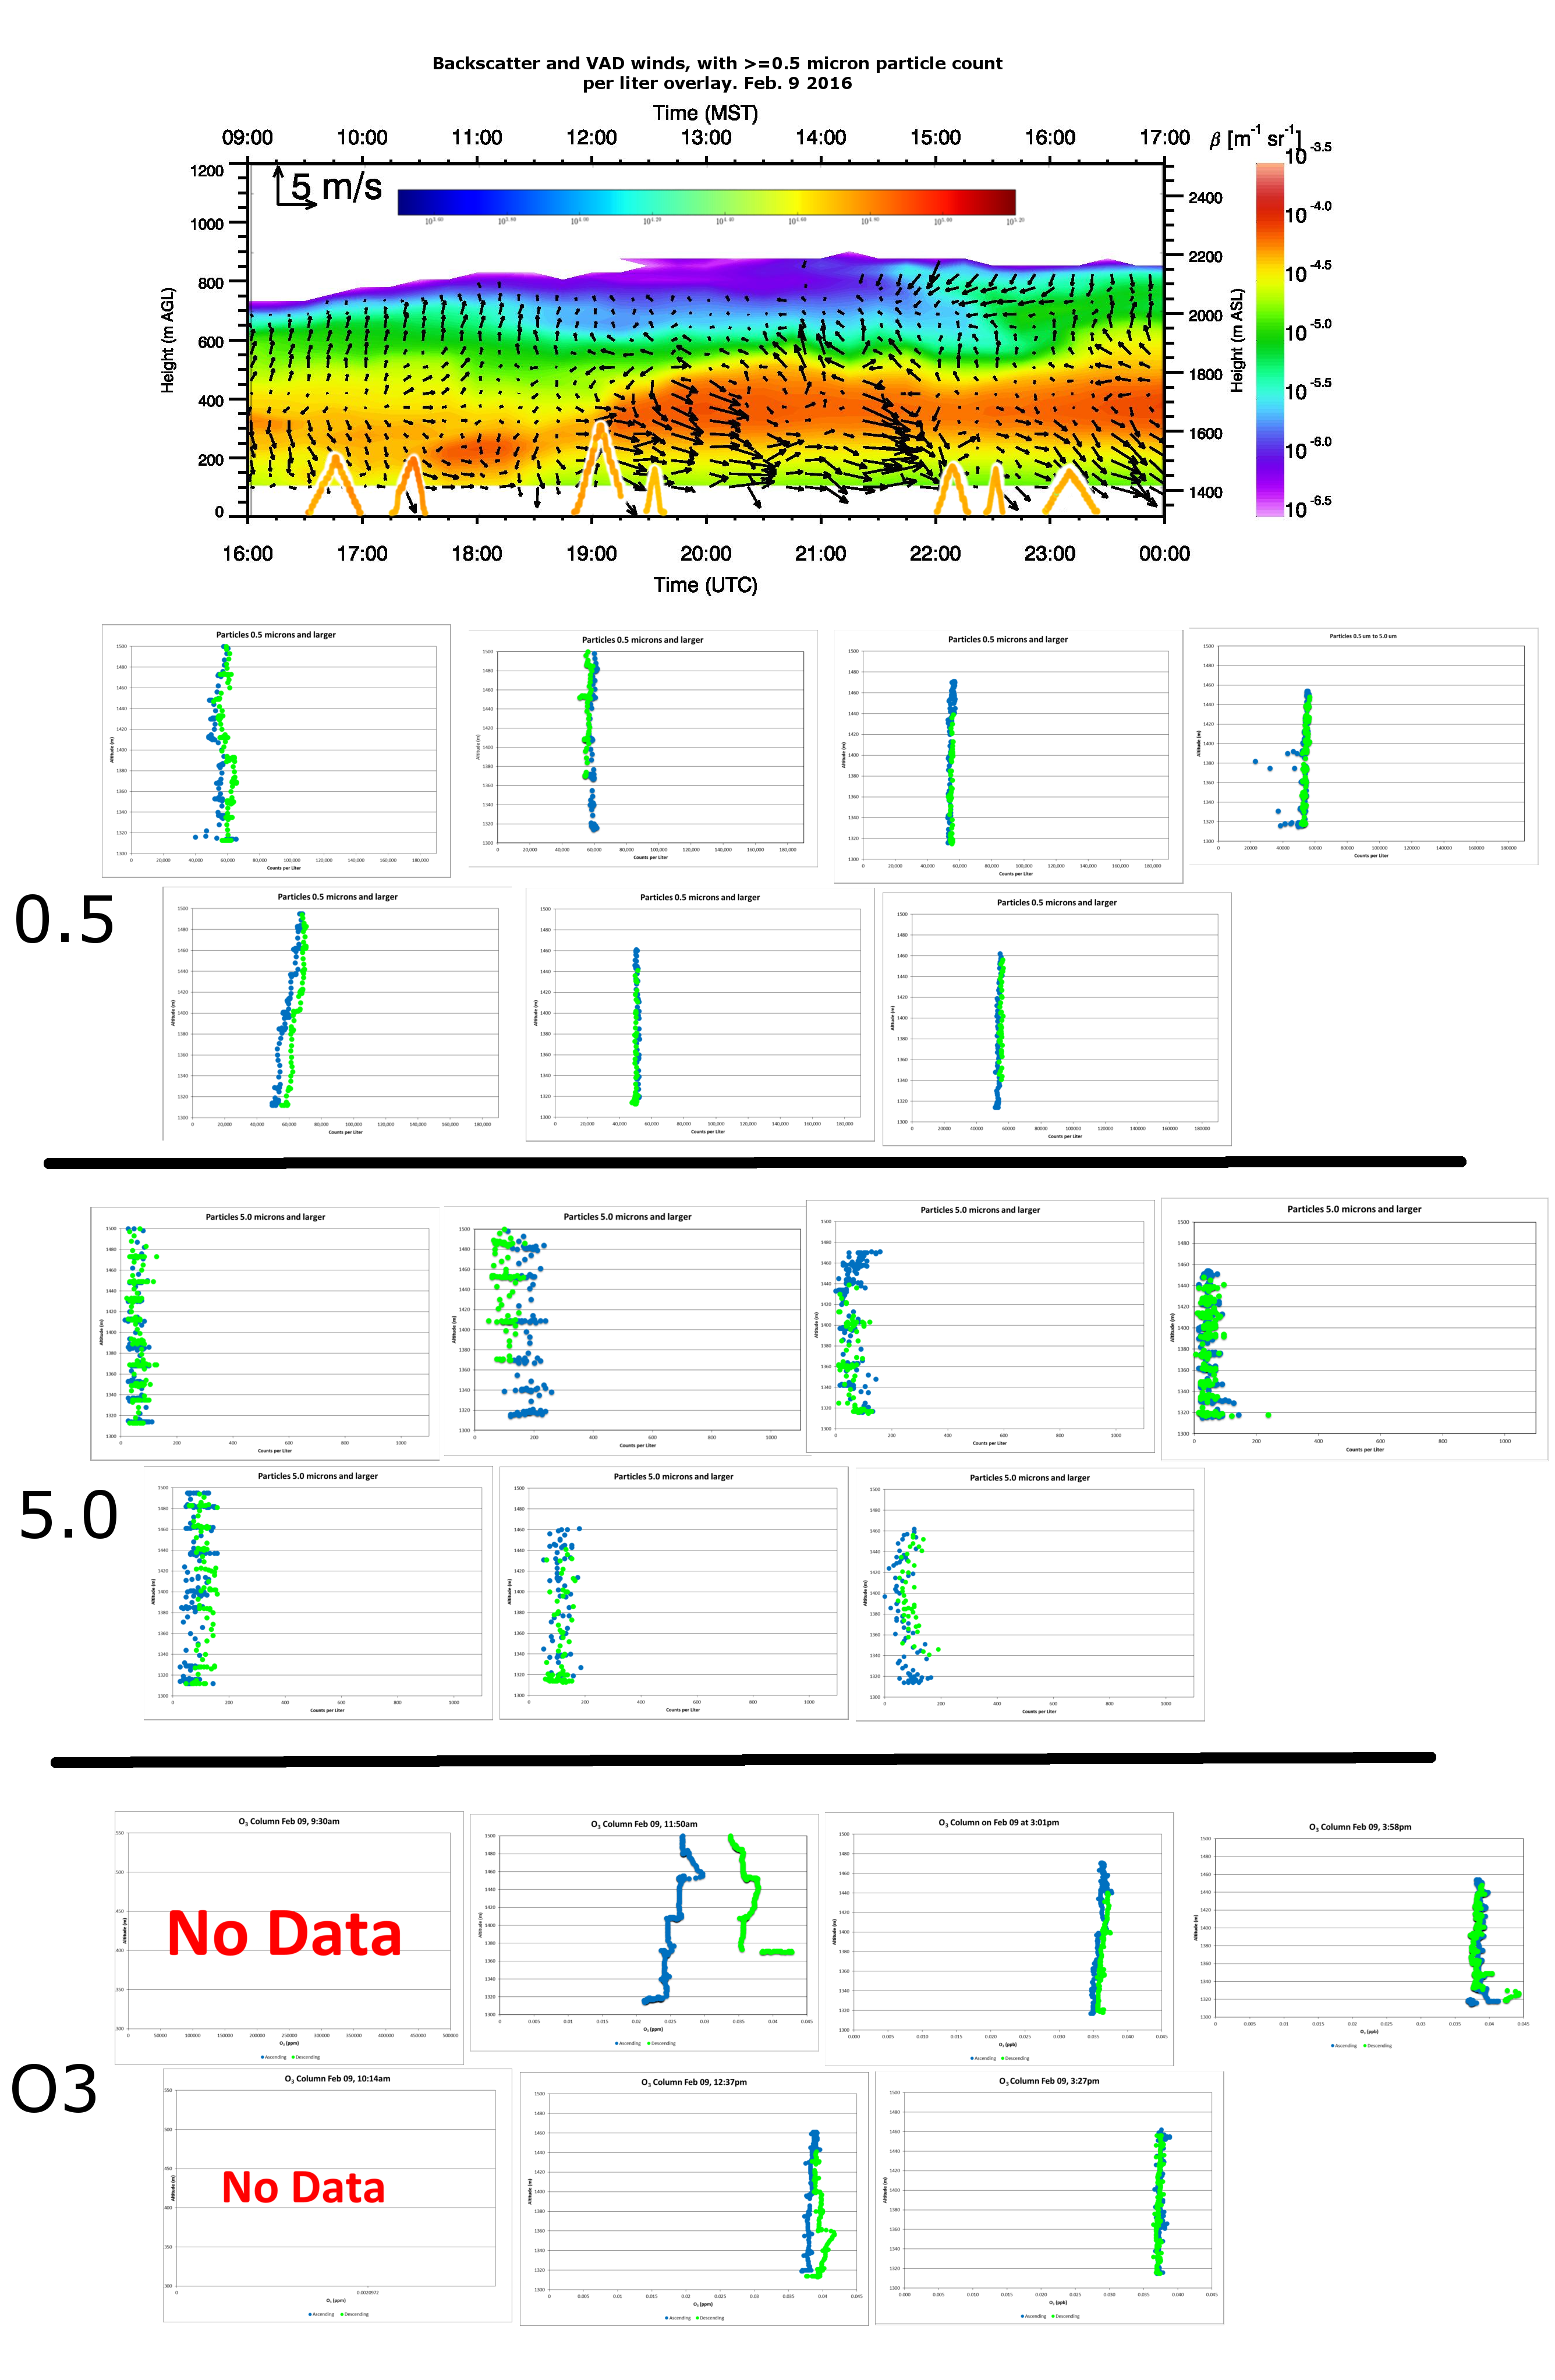
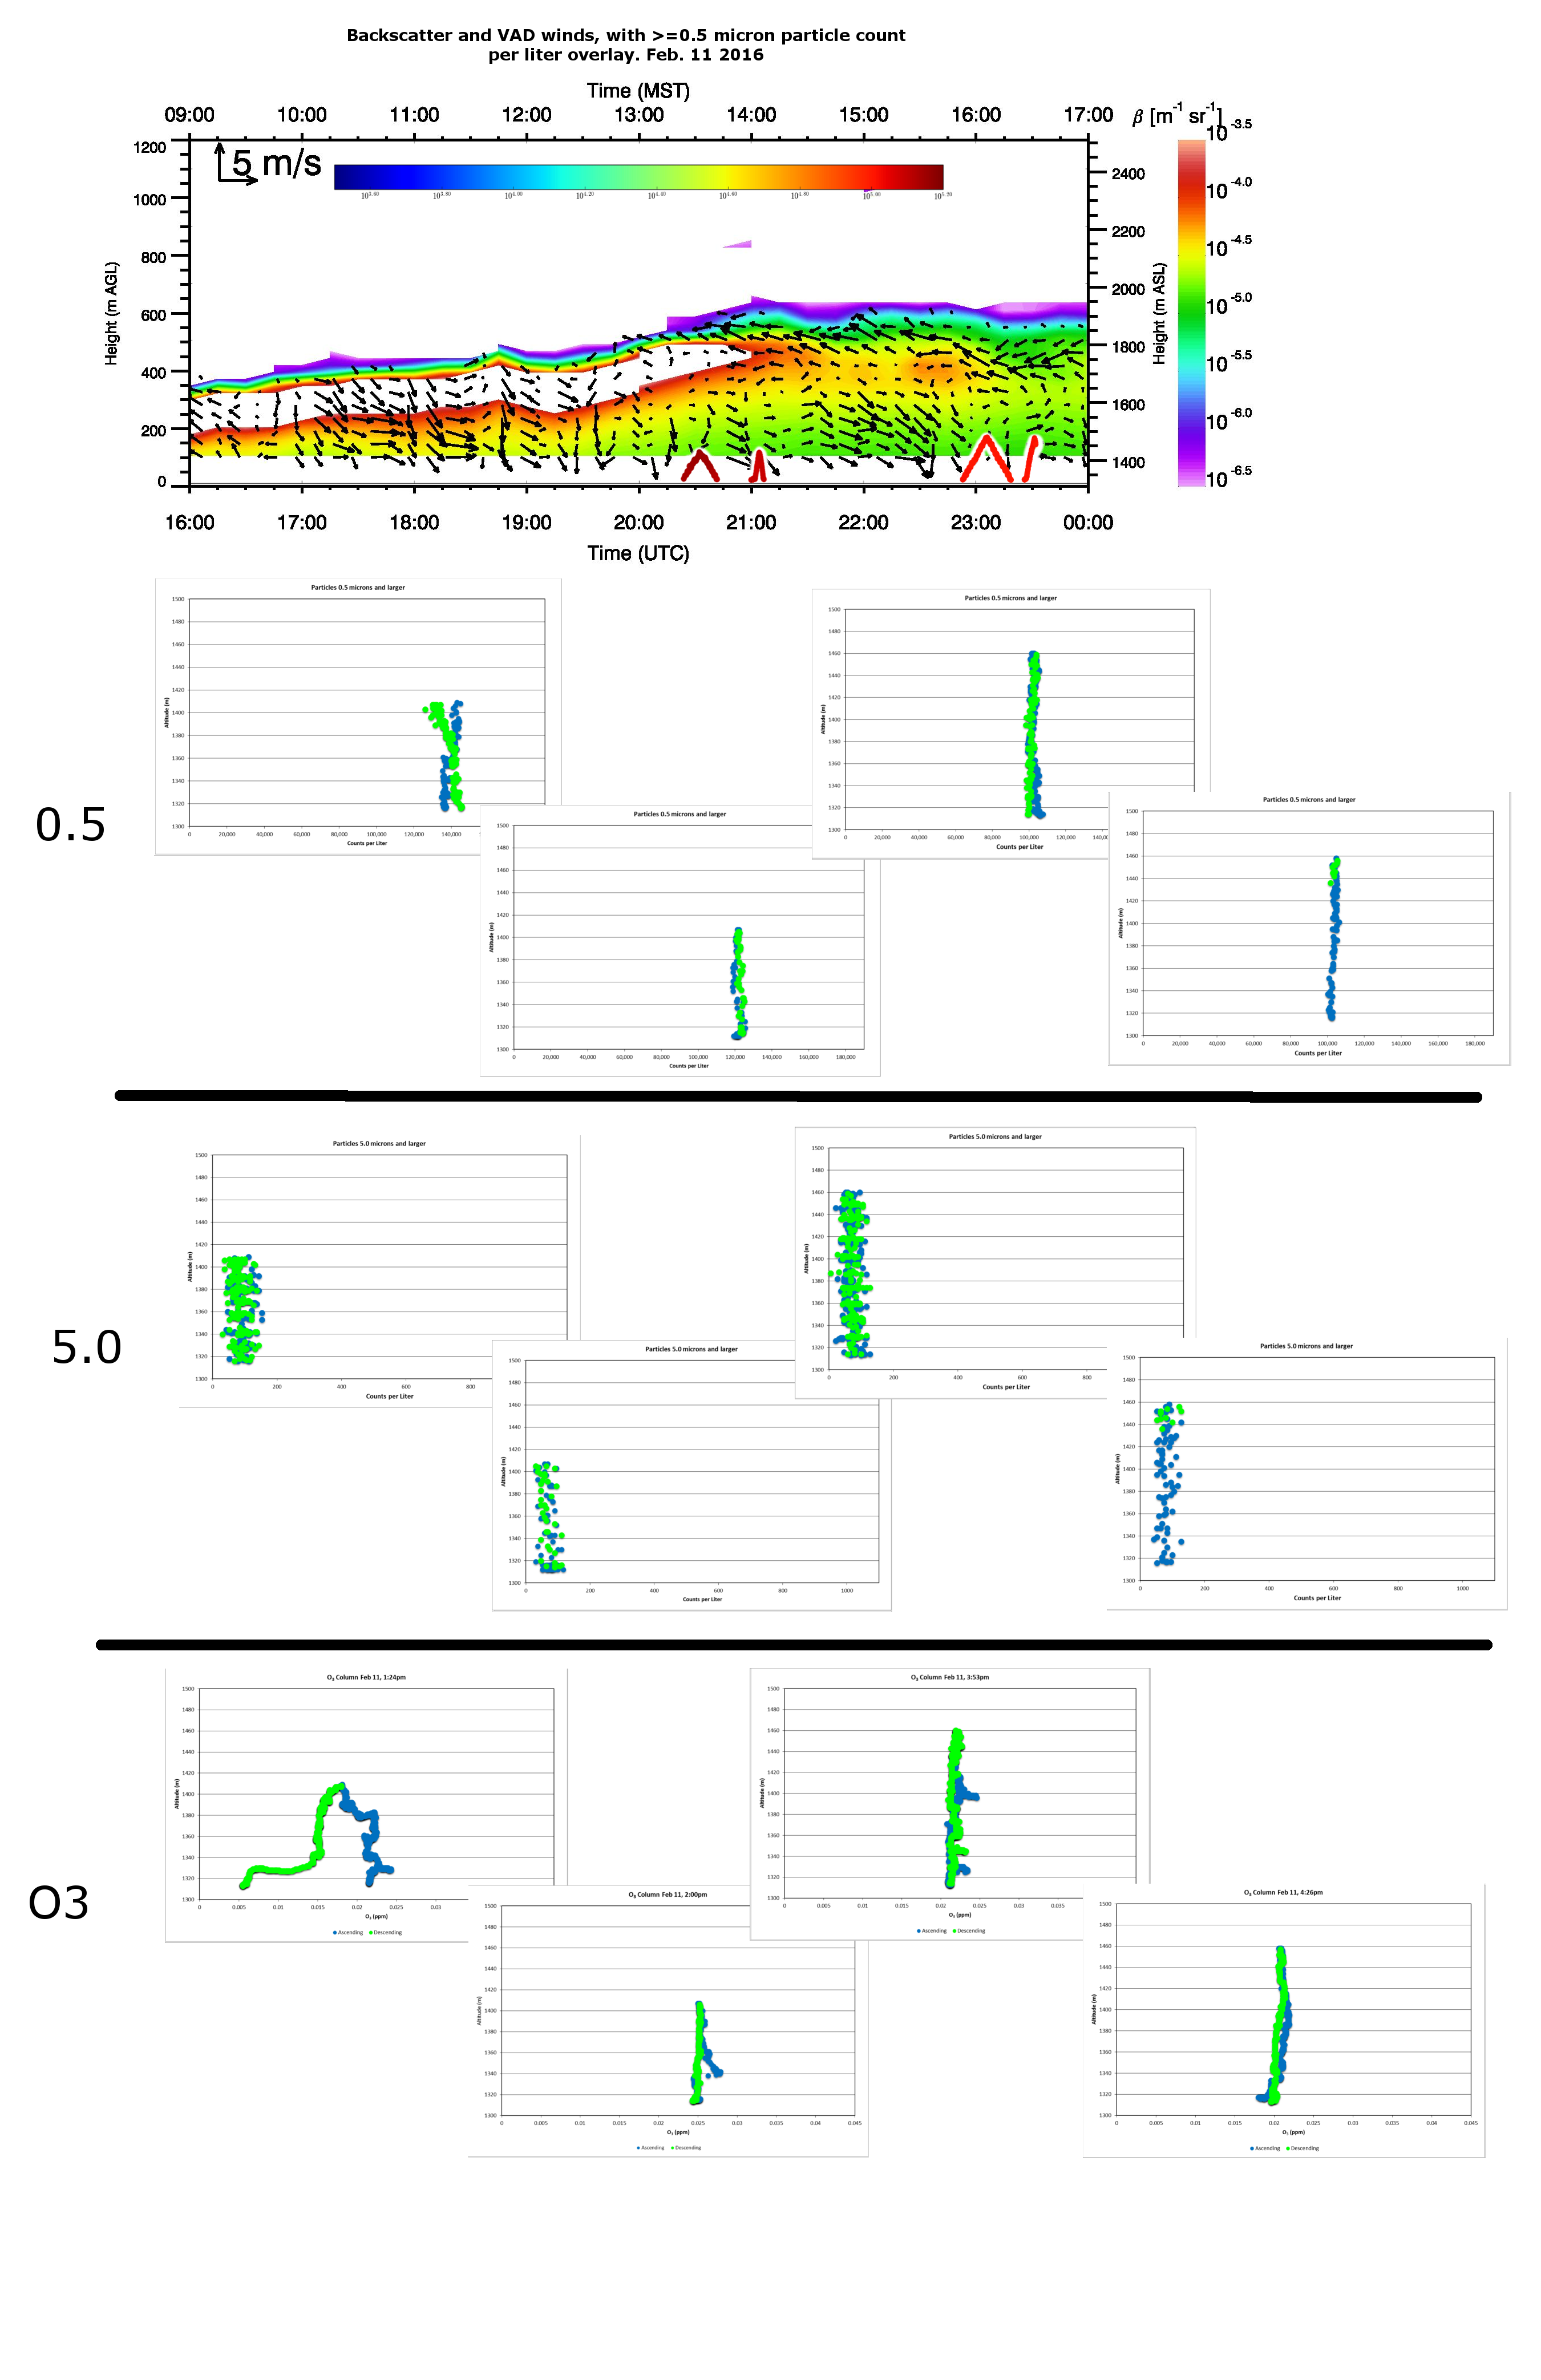
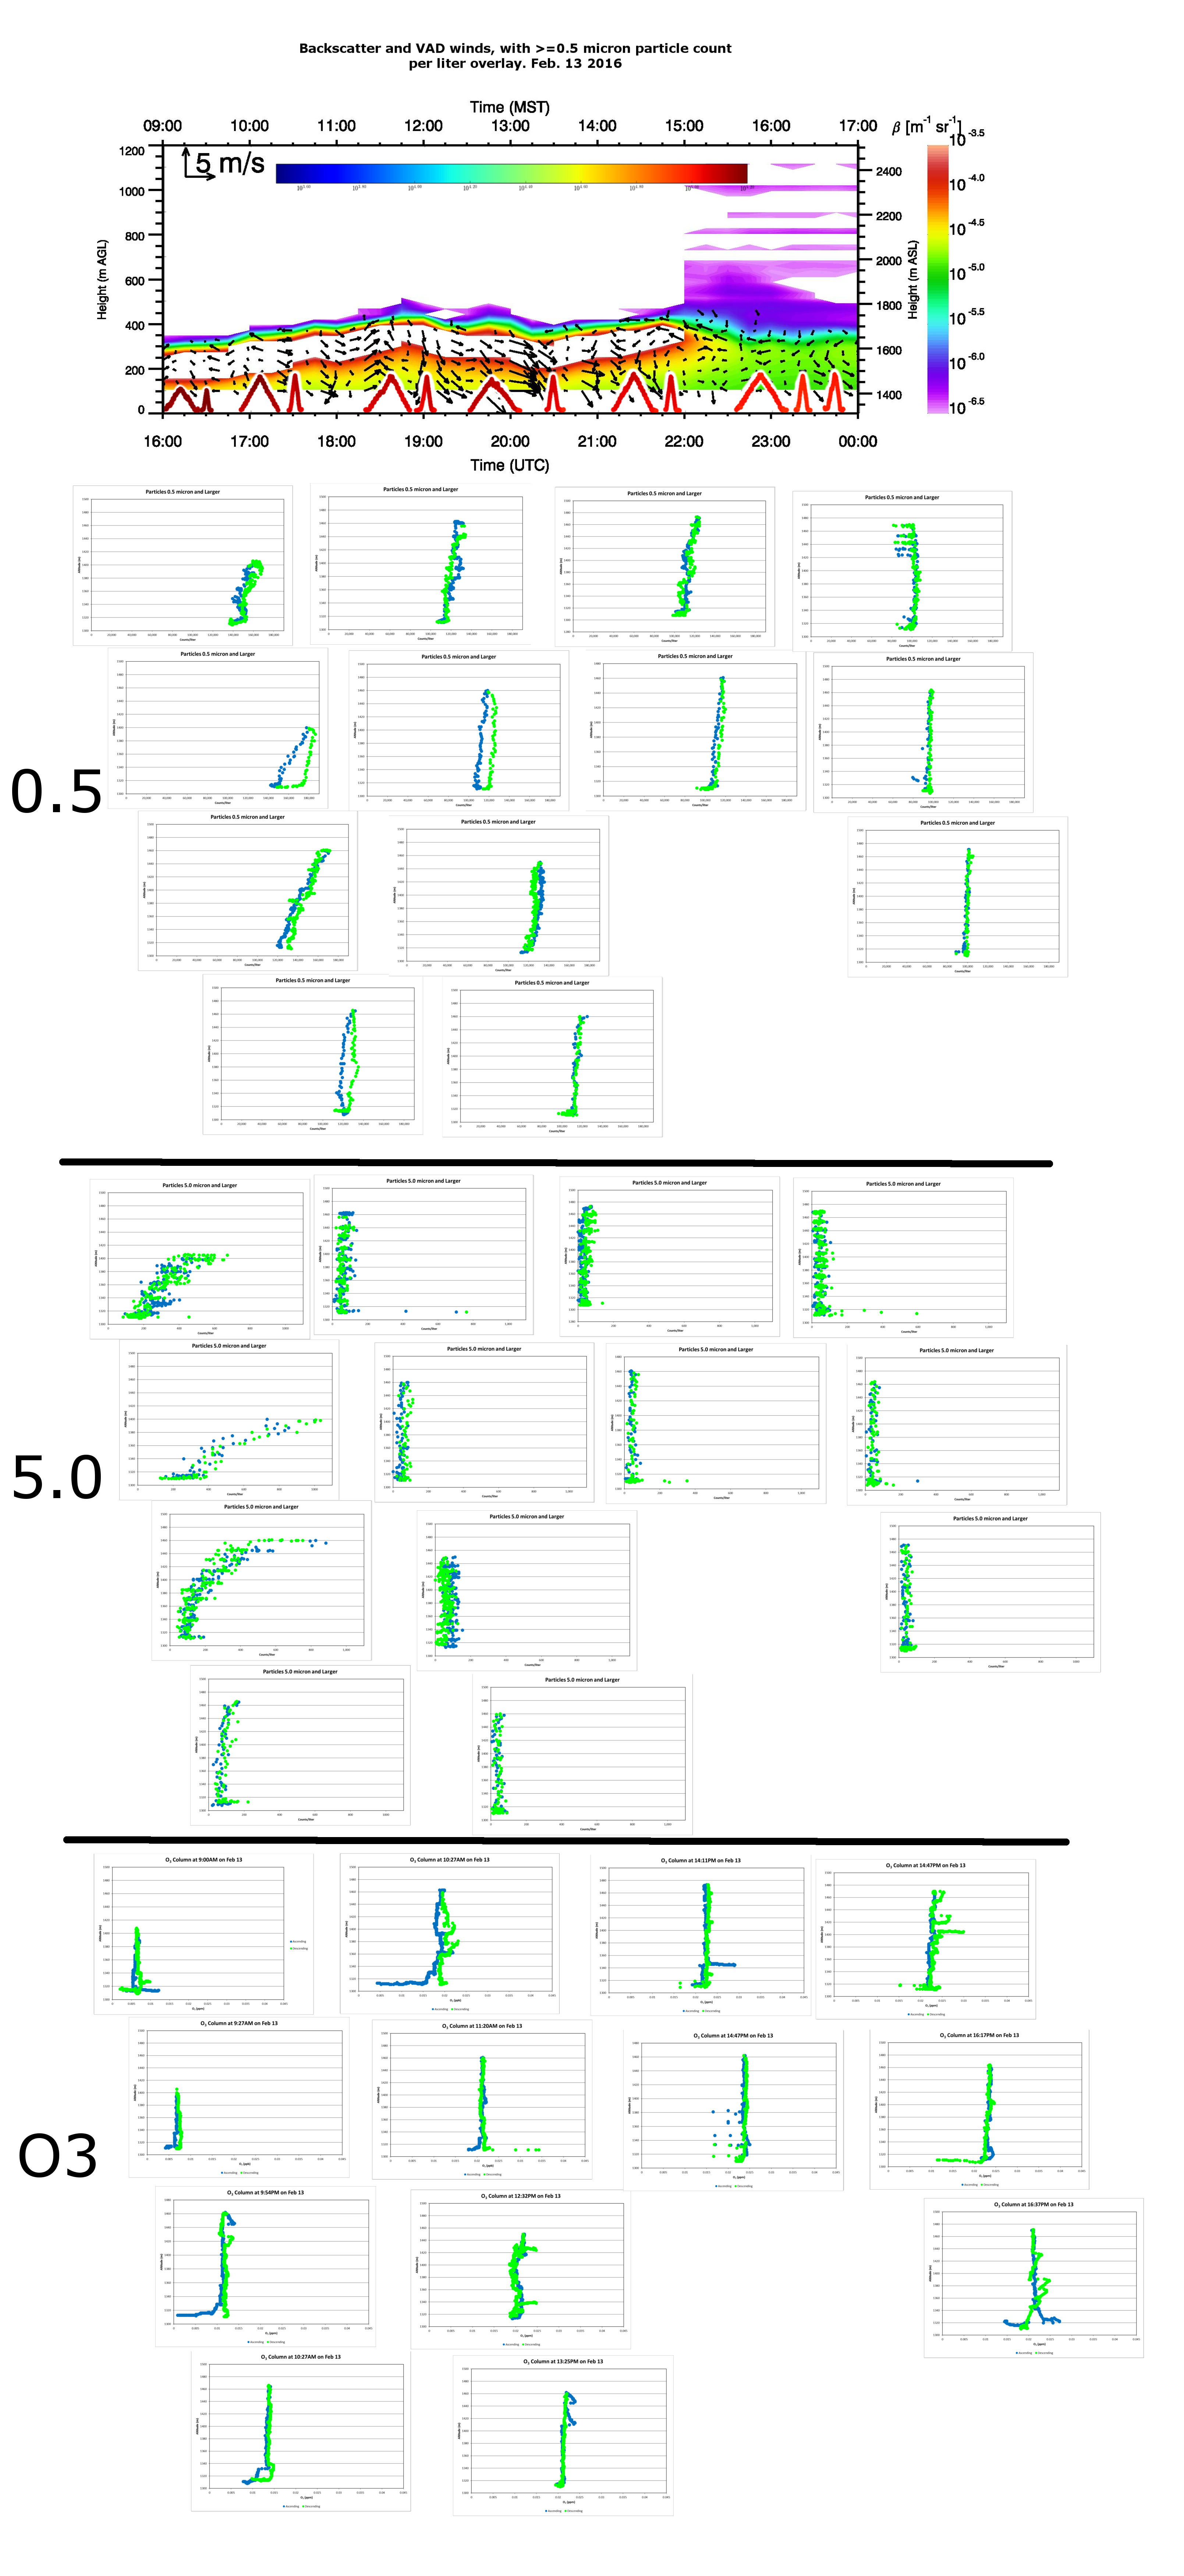
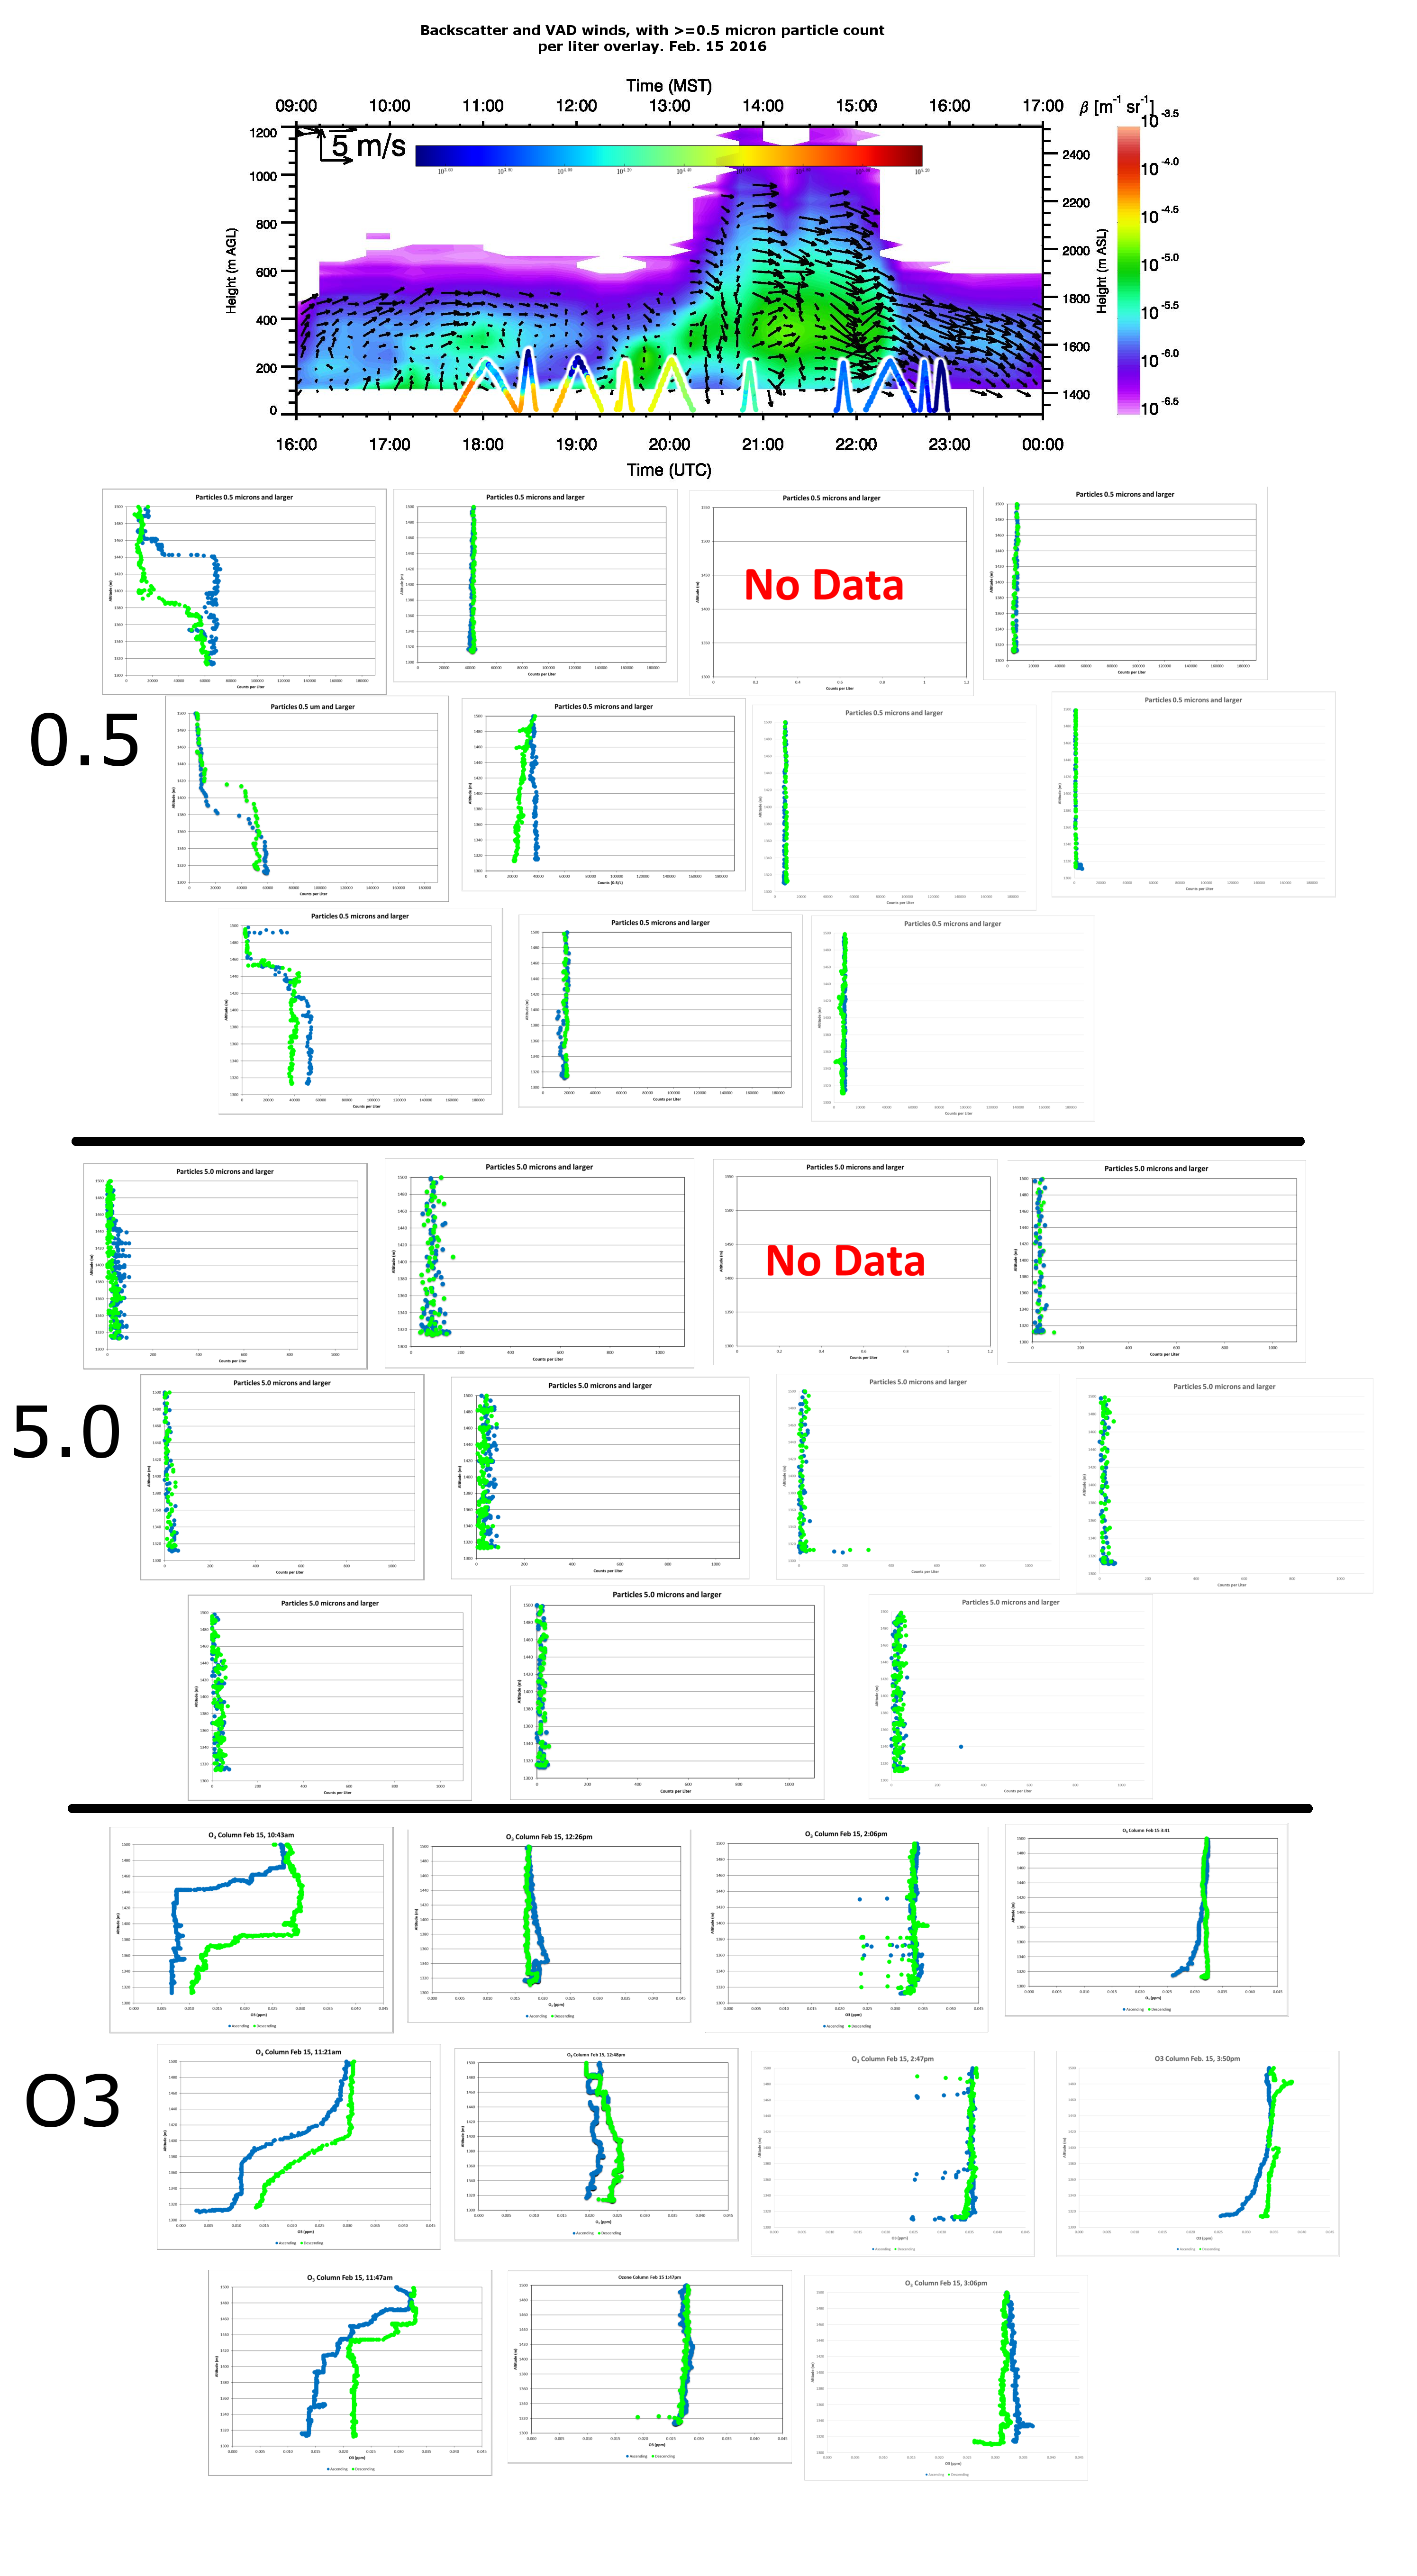
In the images below, the lidar data that we are plotting on top of were collected by the University of Utah's Department of Atmospheric Sciences.
Feb 6, 2016
Full data set for Aerostat160206.
Feb 9, 2016
Full data set for Aerostat160209.
Feb 11, 2016
Full data set for Aerostat160211.
Feb 13, 2016
Full data set for Aerostat160213.
Feb 15, 2016
Full data set for Aerostat160215.
Here is a map of the locations of the primary data collection sites:
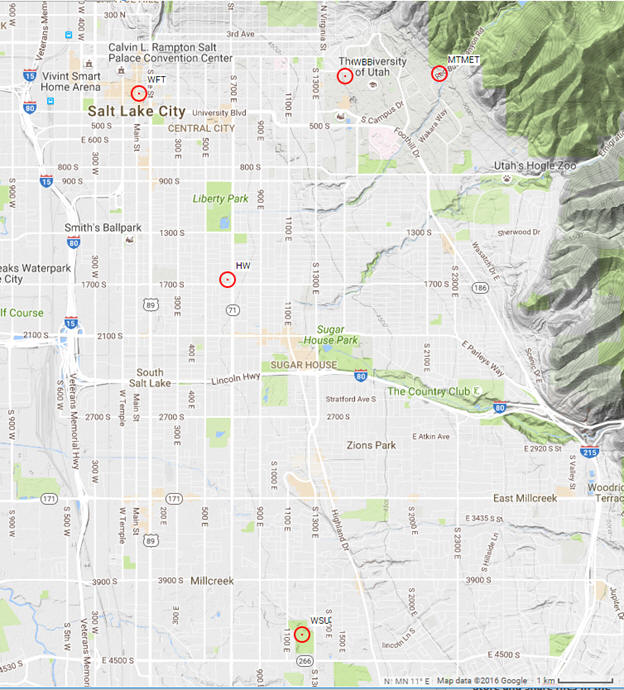
The two lead organizations were the University of Utah Department of Atmospheric Sciences and the Utah Division of Air Quality. Utah State University UWRL provided multiple ammonia monitoring stations through out the valley. The Weber State University, Department of Physics, HARBOR team was collecting data at the location shown at the bottom of this map. This location (WSU) is 6.34 km SSE of the Hawthorne (HW) Elementary UDAQ air monitoring site.