UWFPS-2017 = Utah Winter Fine Particulate Study 2017 (Winter inversion study)
All HARBOR Aerostat ("tethersonde") 2017 raw data can be found here.
This is a page for the rapid deployment of data and images for the WSU Winter Inversion vertical column measurement campaign funded, in large part, by the Utah Department of Environmental Quality's Division of Air Quality (UDAQ). The visual quality of this page will improve in time, for now it is a location for images and data.
Image credit for all images is: Sheri Trbovich, Weber State University, HARBOR program.
Image captions will be put in place later today.
Fairly Hi Resolution Images. Downloading the image will result in the full size image:
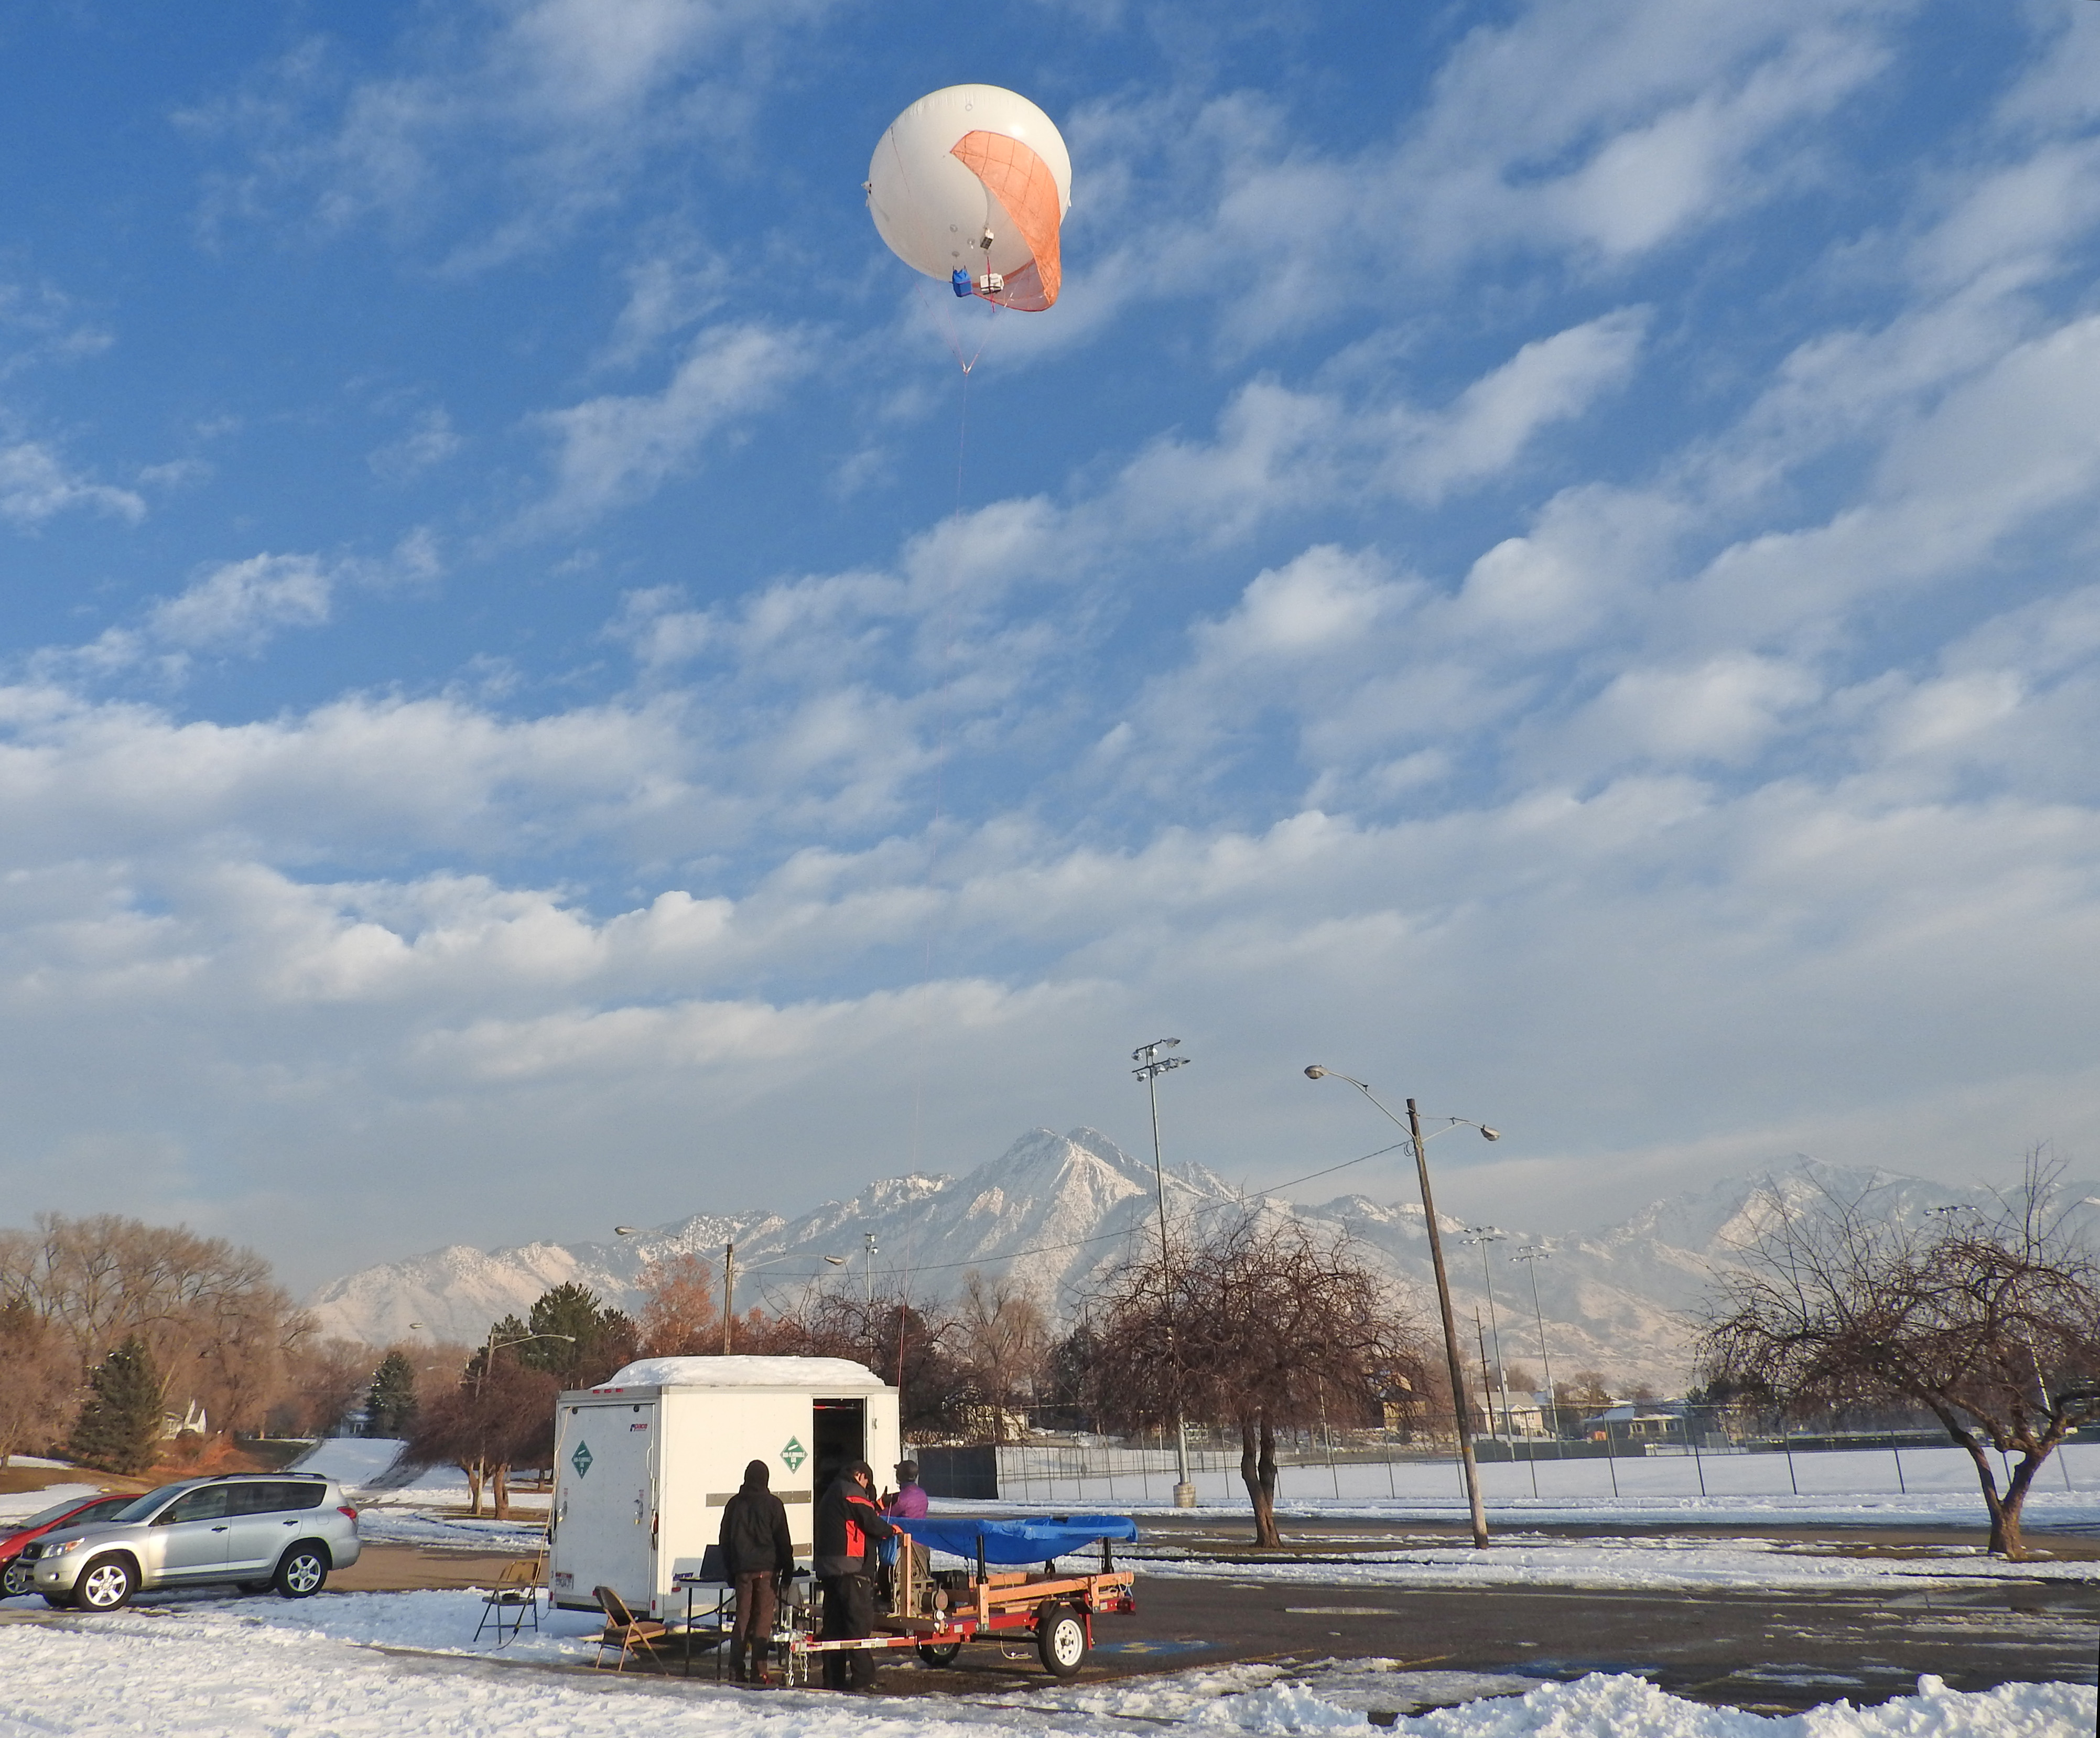
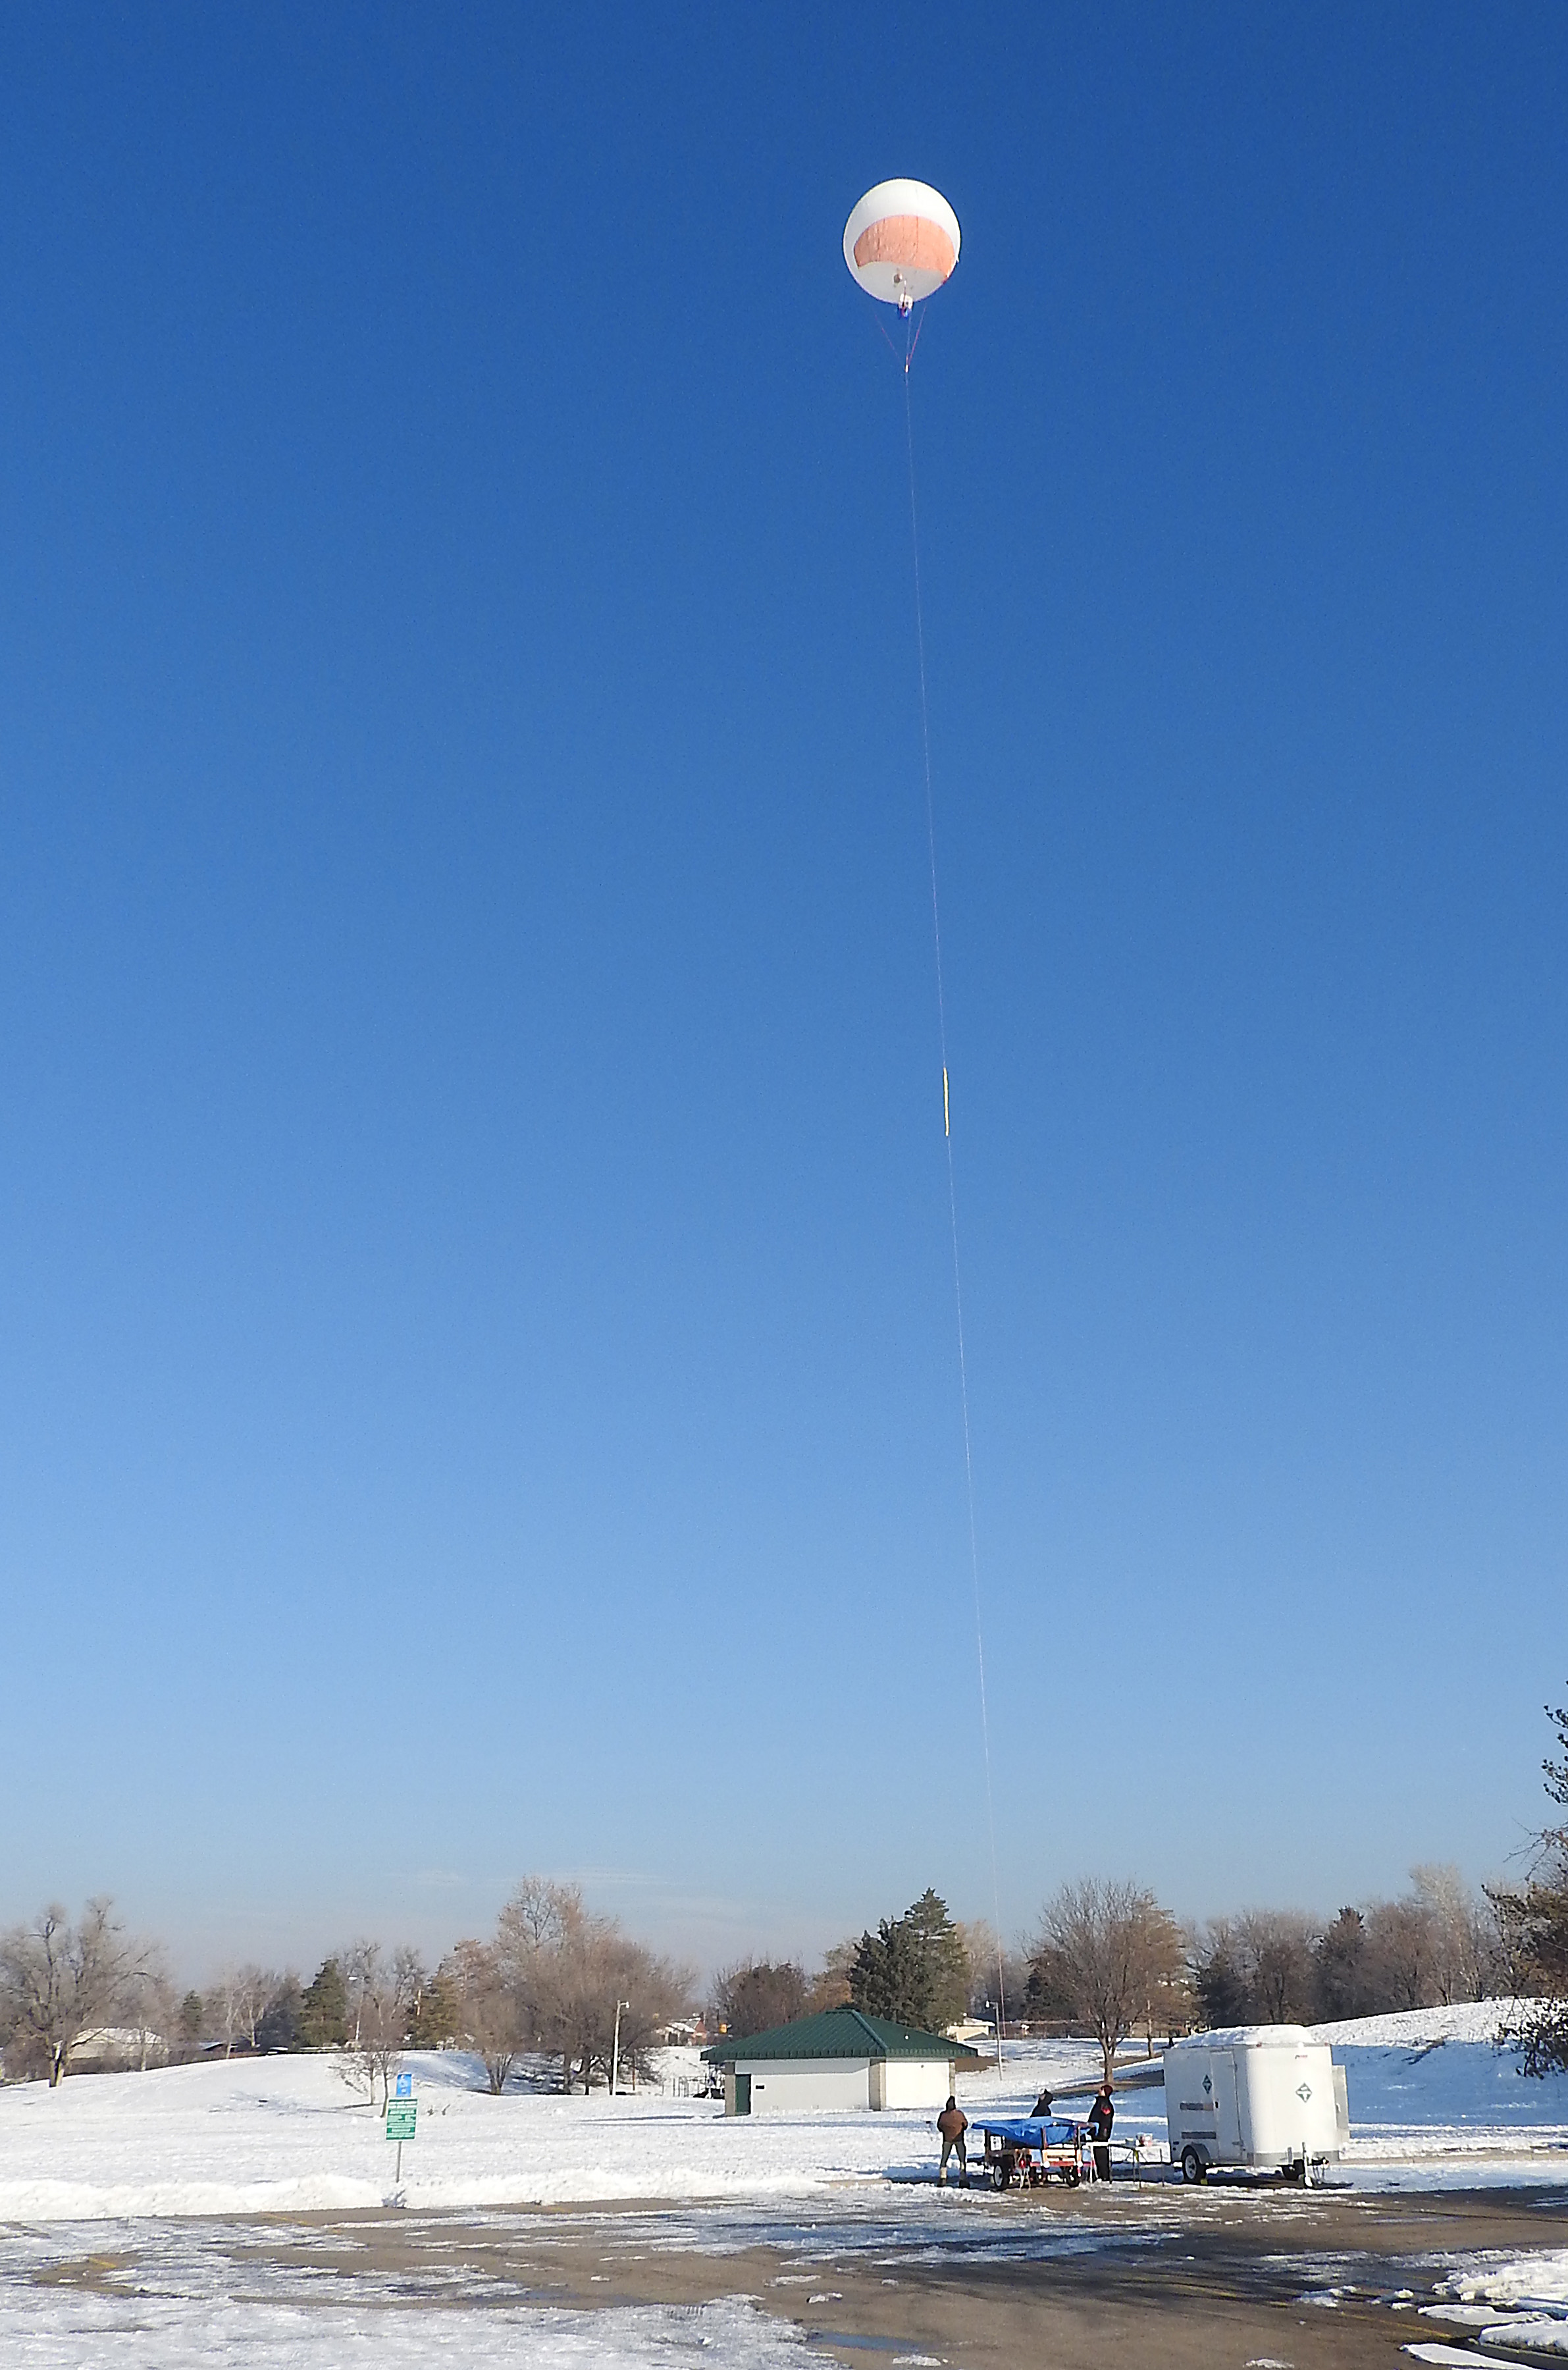
The aerostat in flight at the Millcreek, UT, station at the Larry H. Miller Sports complex (one half mile south of St. Marks Hospital). We are measureing the vertical profile of the lowest 500 feet of Utah's air during a slight inversion event. You can see the haze between the camera and the distant mountains in the background. Personnel, L to R: Johnny Nikoloff, Michael Hess, John Sohl..
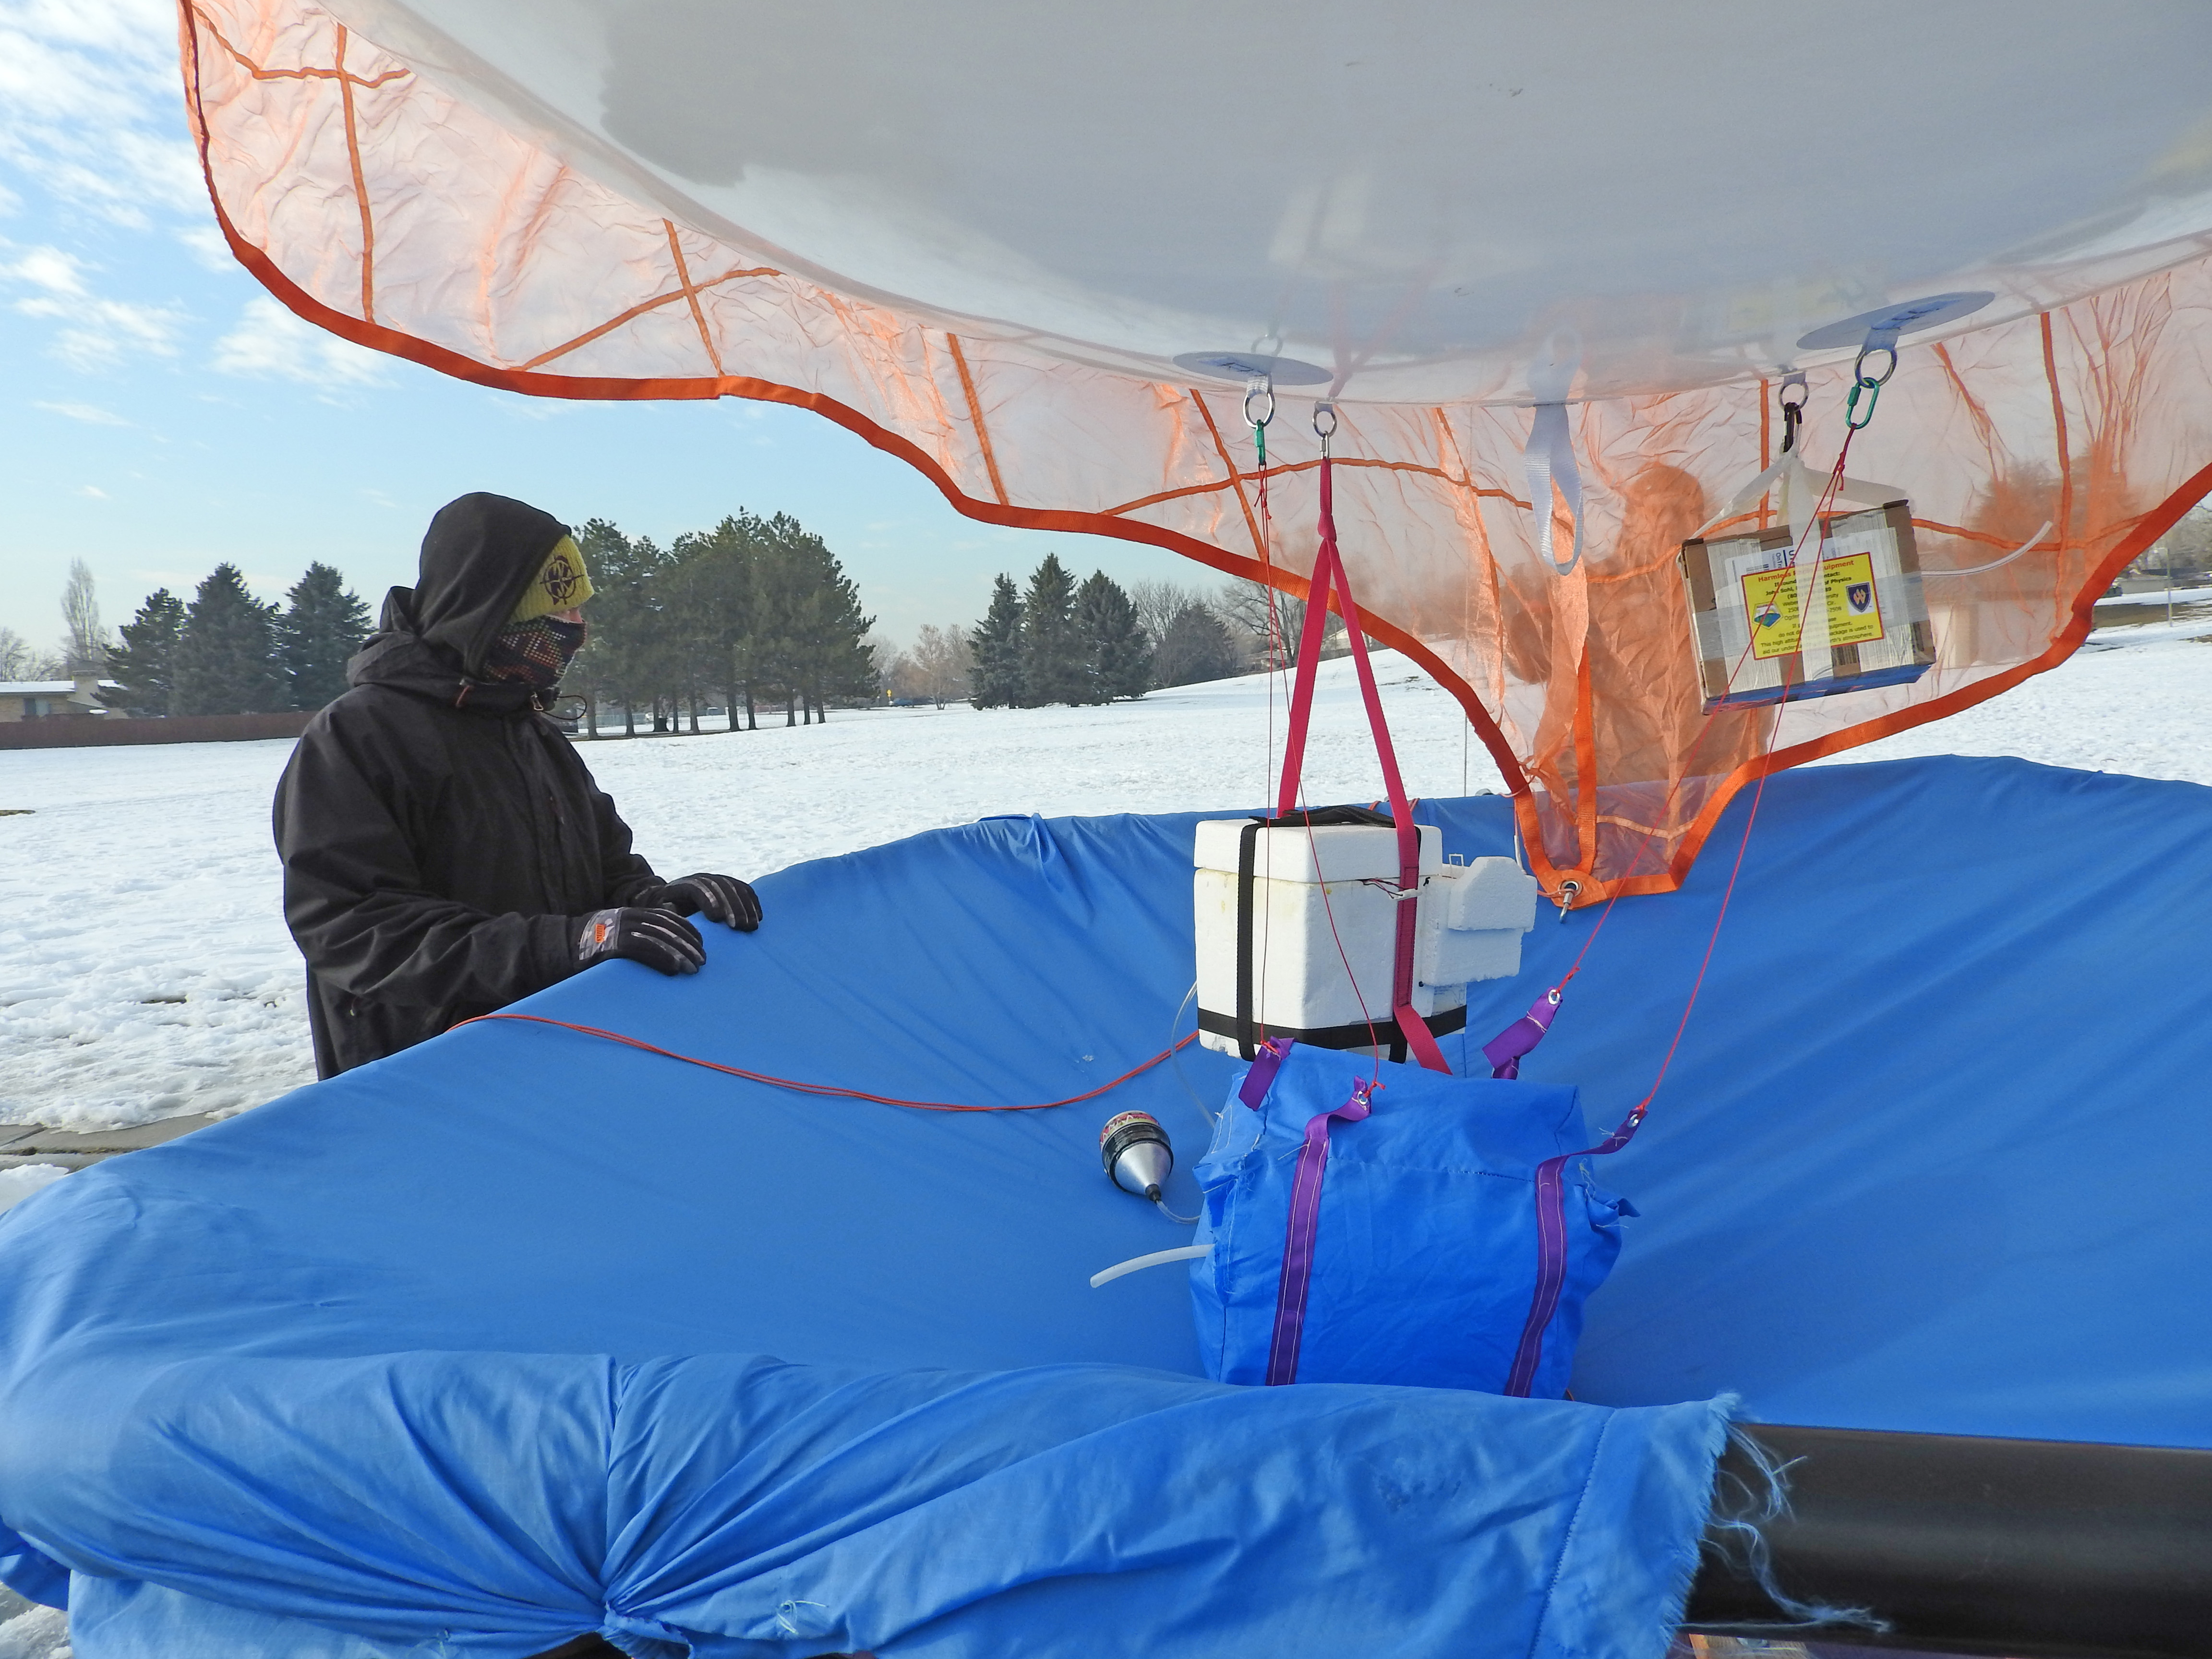
Below: The beginning of a typical flight with full payload (approx. 5 kg). Sohl and Nikoloff are operating the winch used to control the aerostat while Hess is checking the data download link. Personnel L-R: John Sohl, Johnny Nikoloff, Michael Hess.
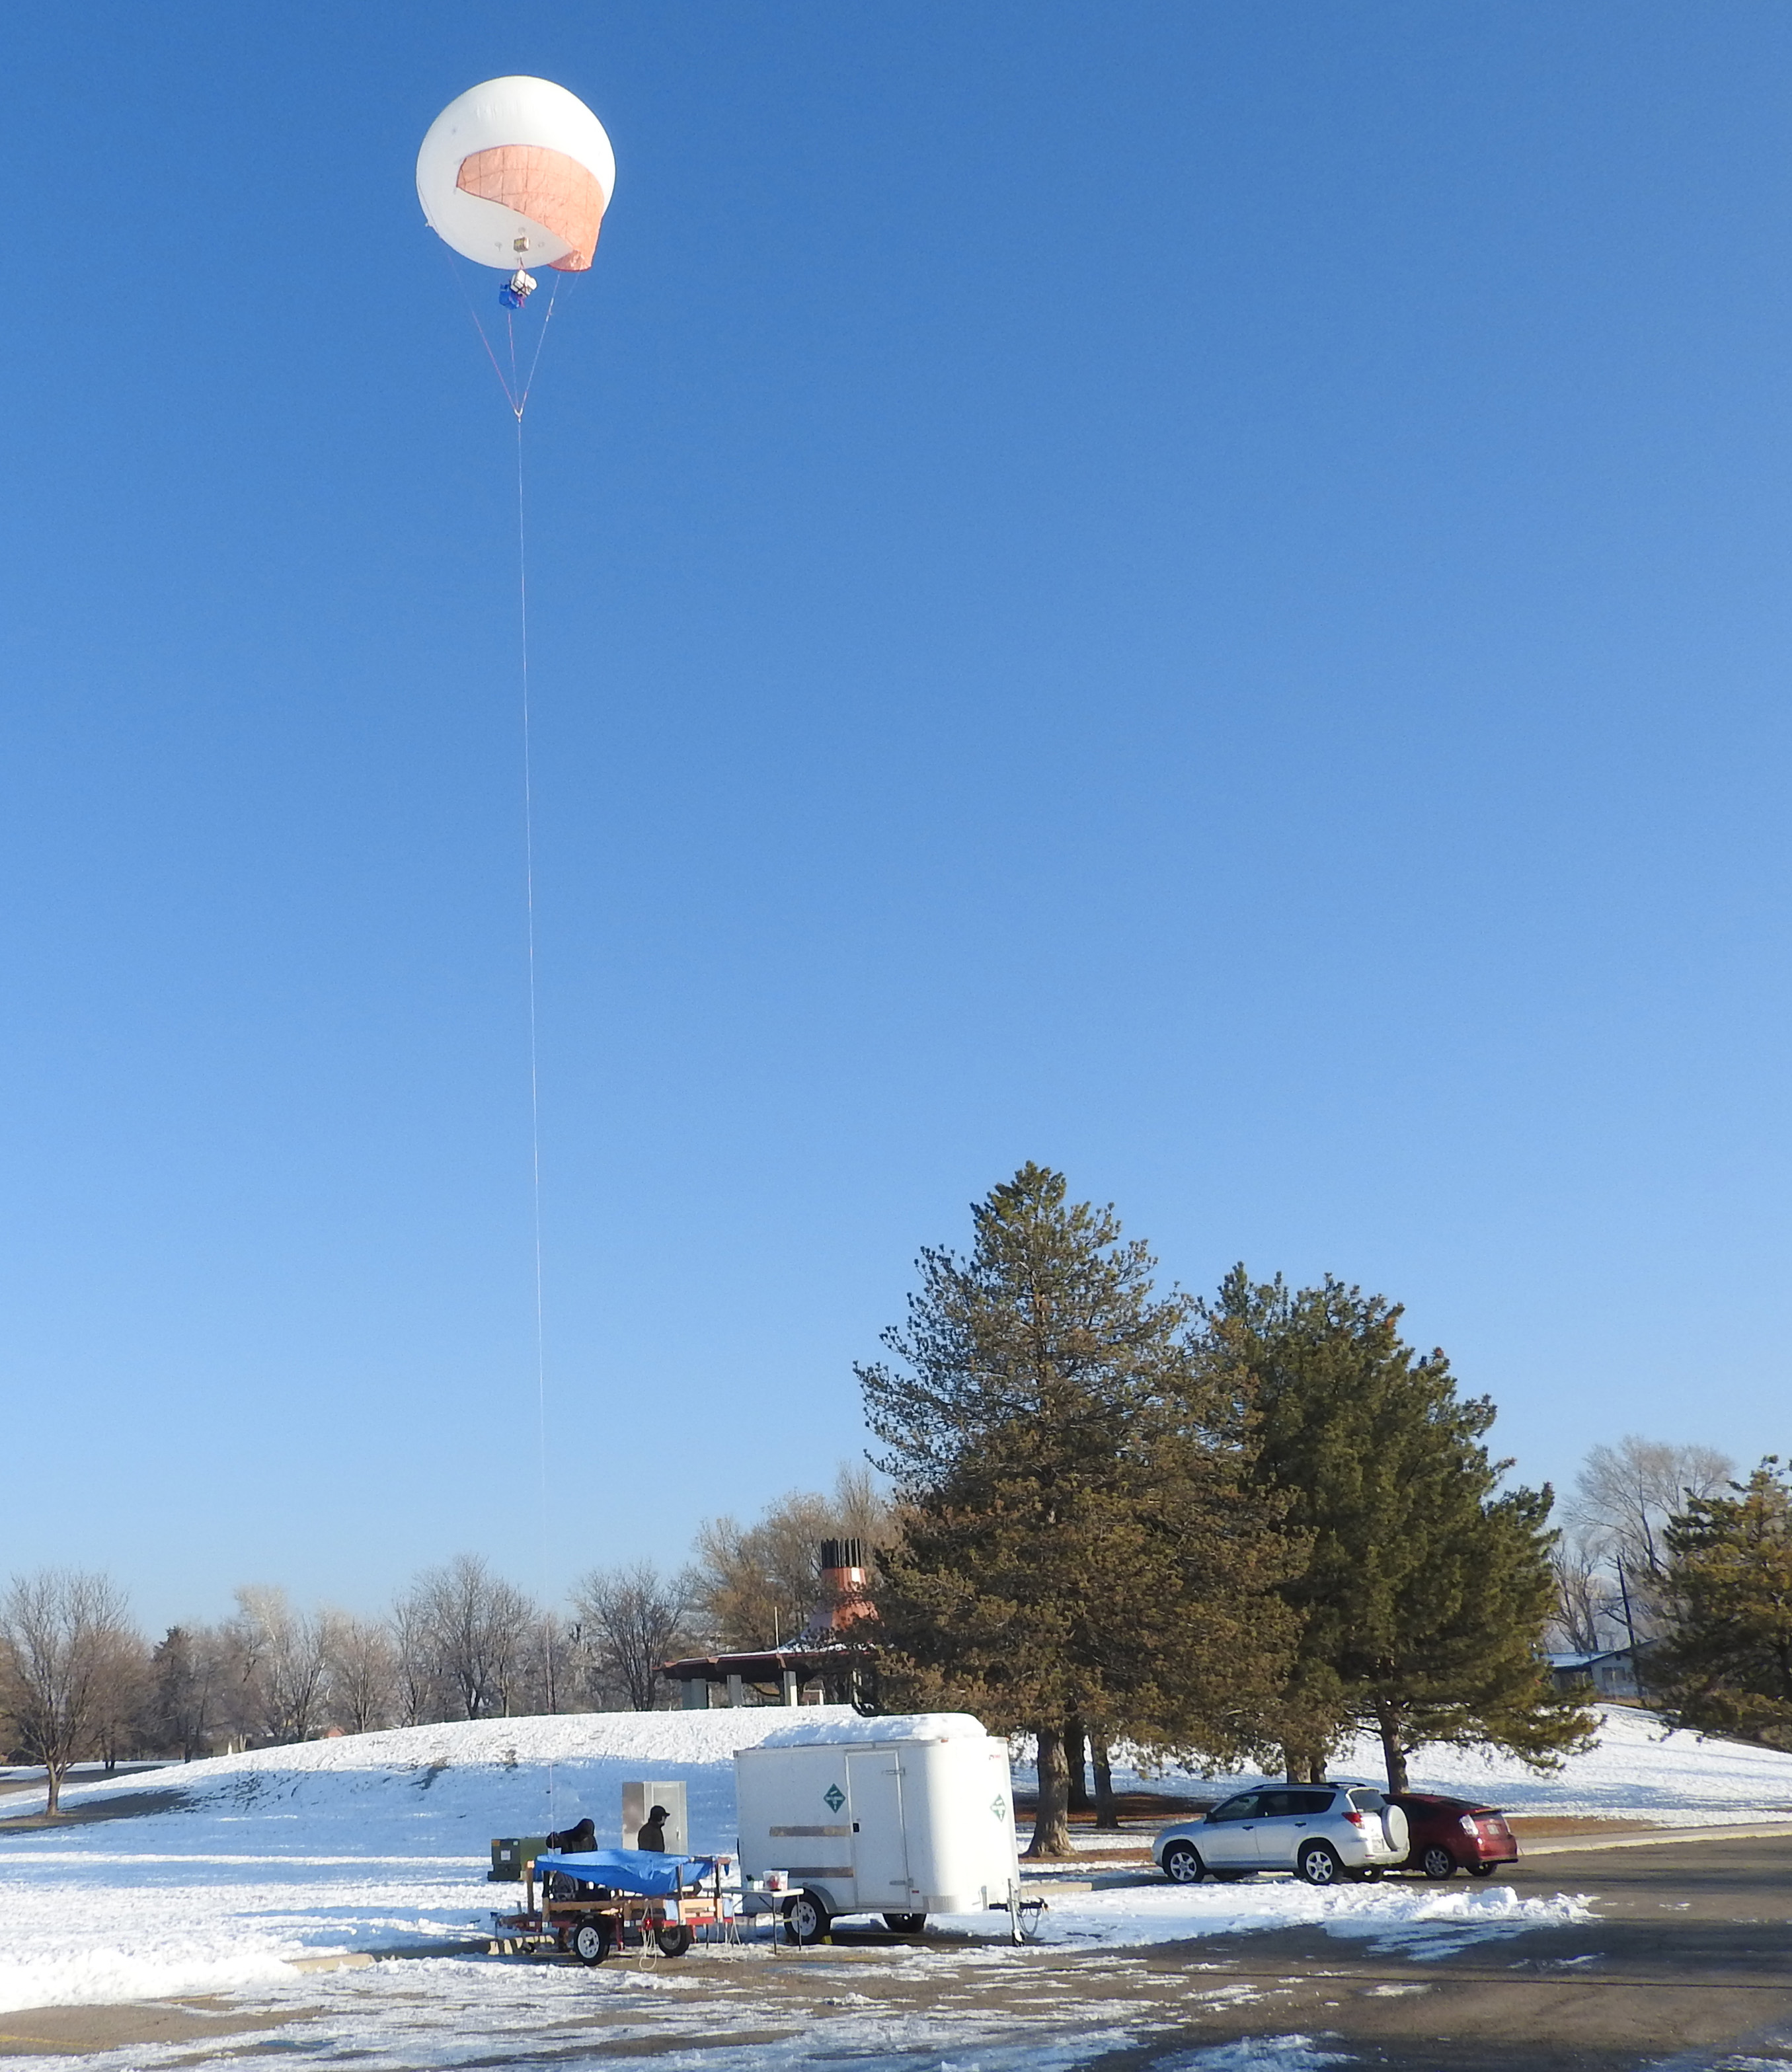
Below: Aerostat flight with payloads. This is 50 feet AGL (above ground level). We stop every 50 feet to let the sensors dwell for a minute and to clip on a flag on the teather to make it easier for aircraft to see the line. Personnel = Johnny Nikoloff, John Sohl
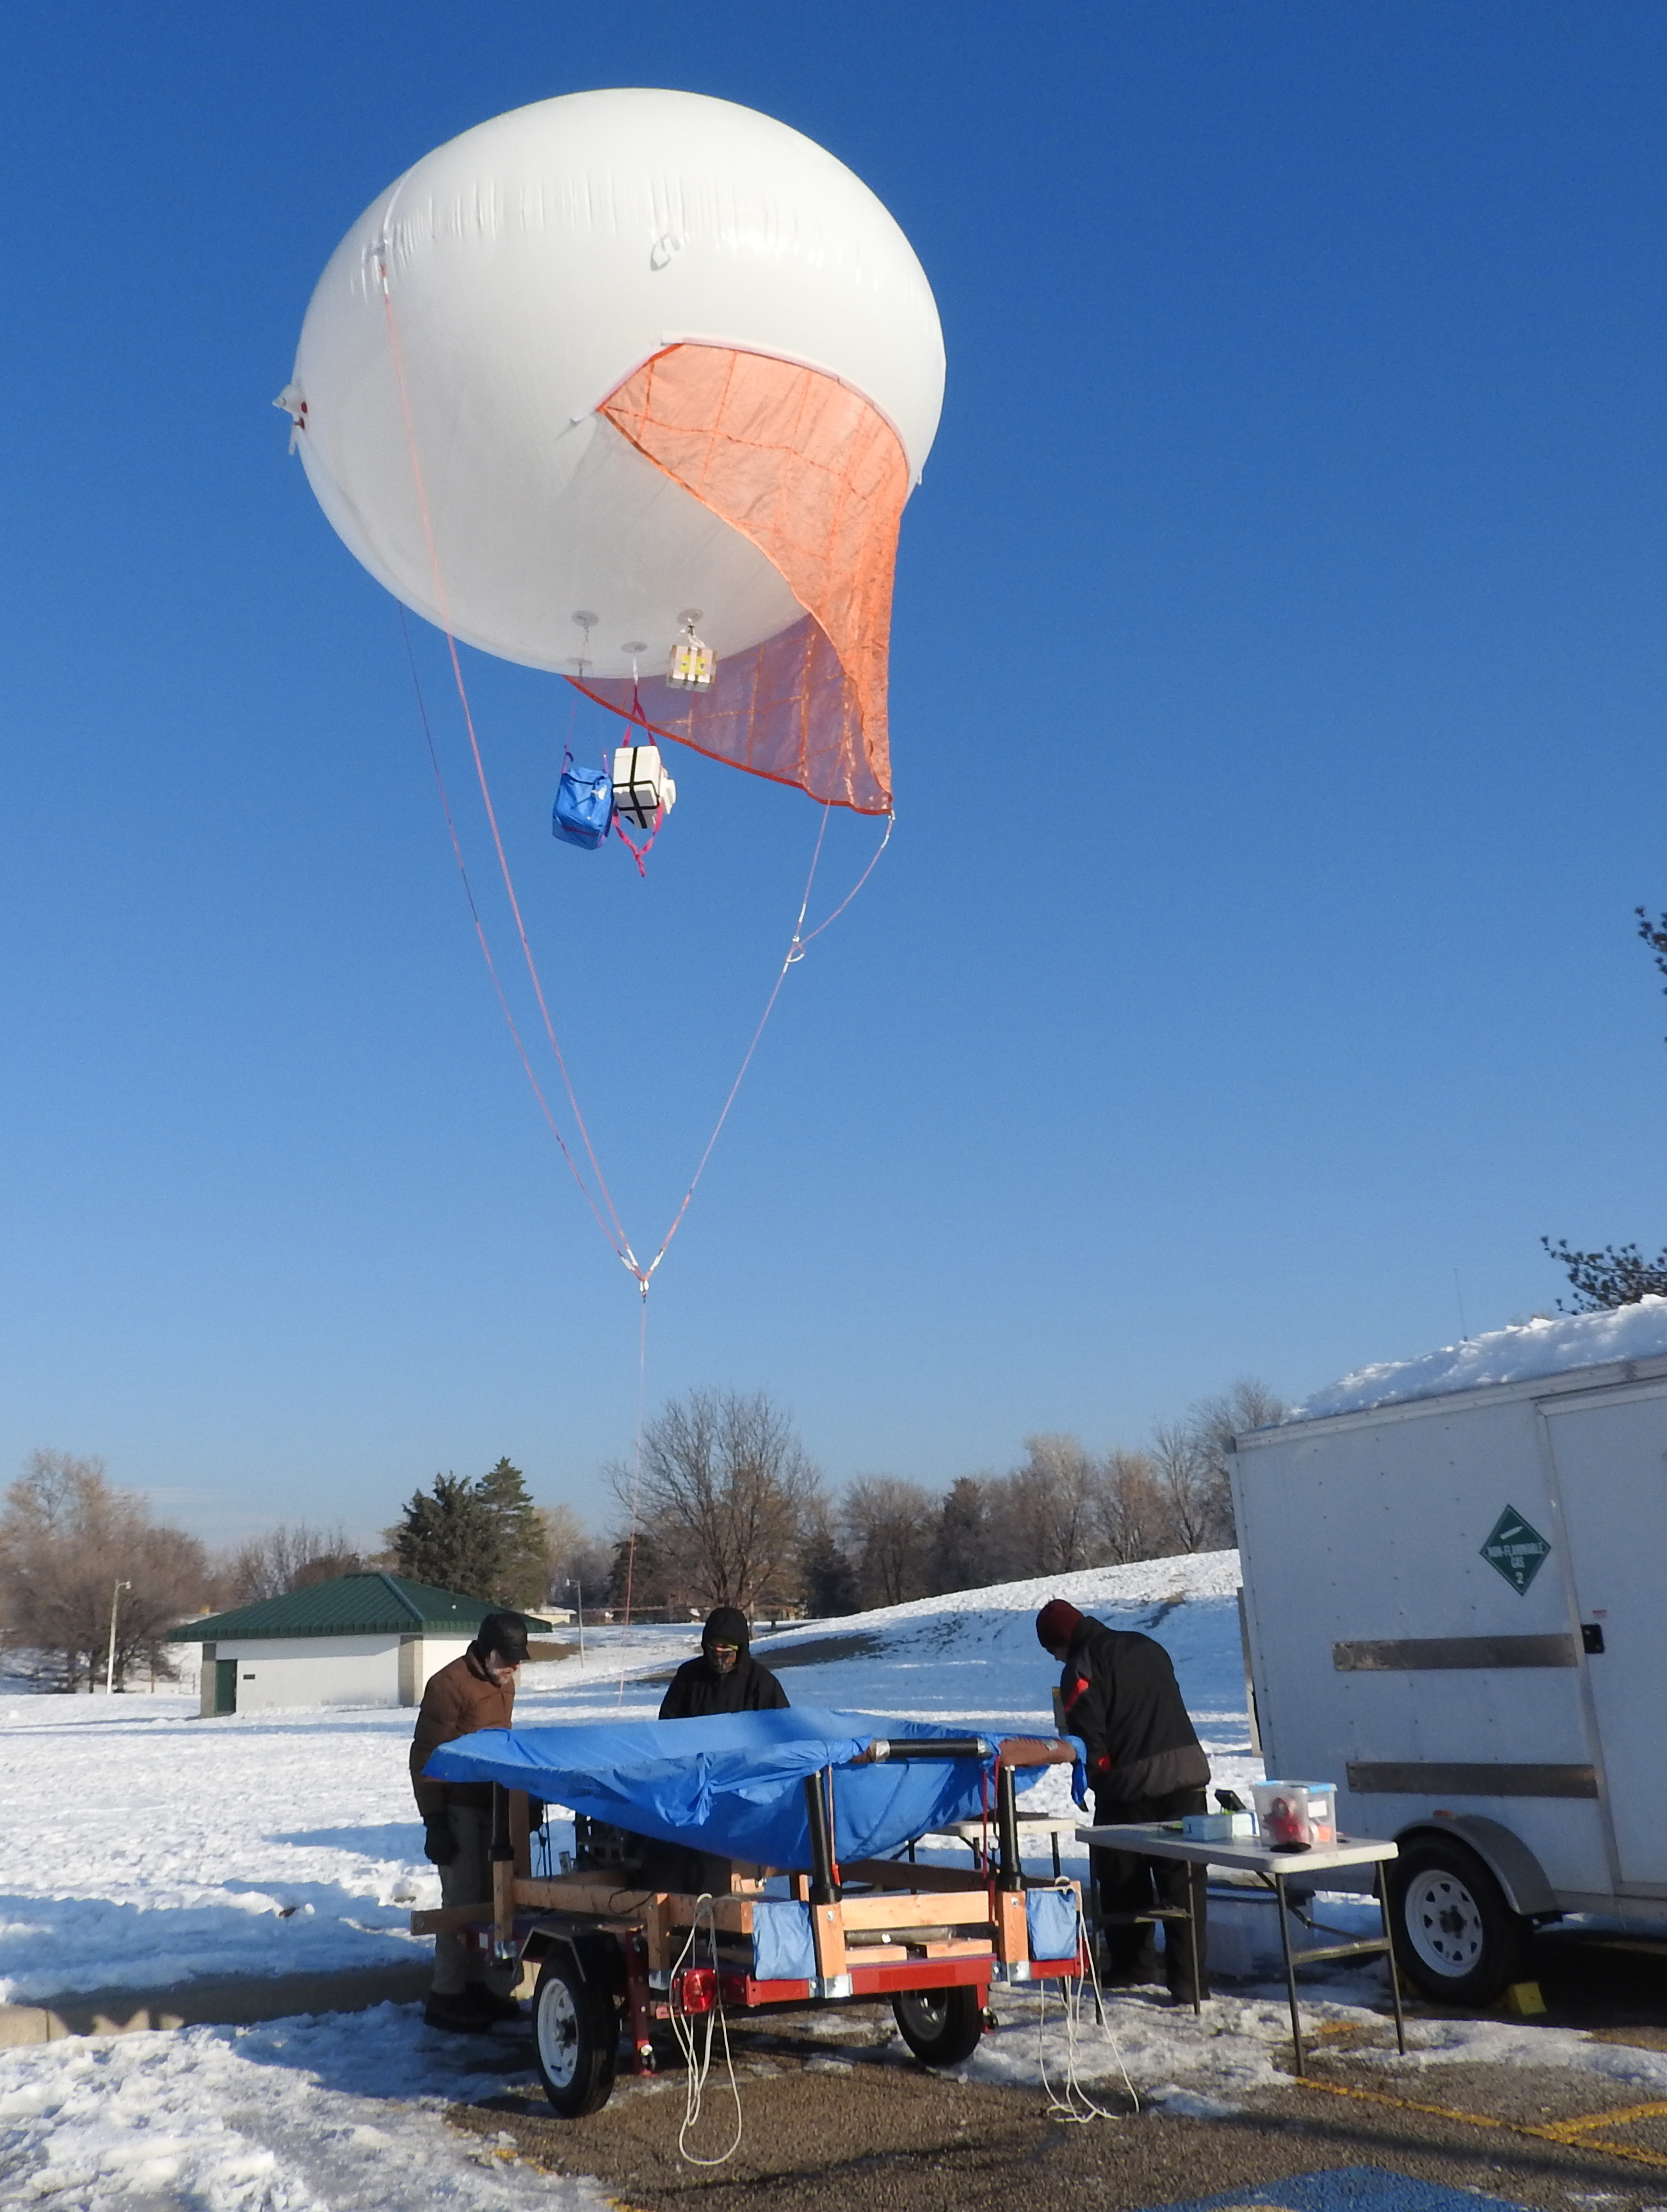
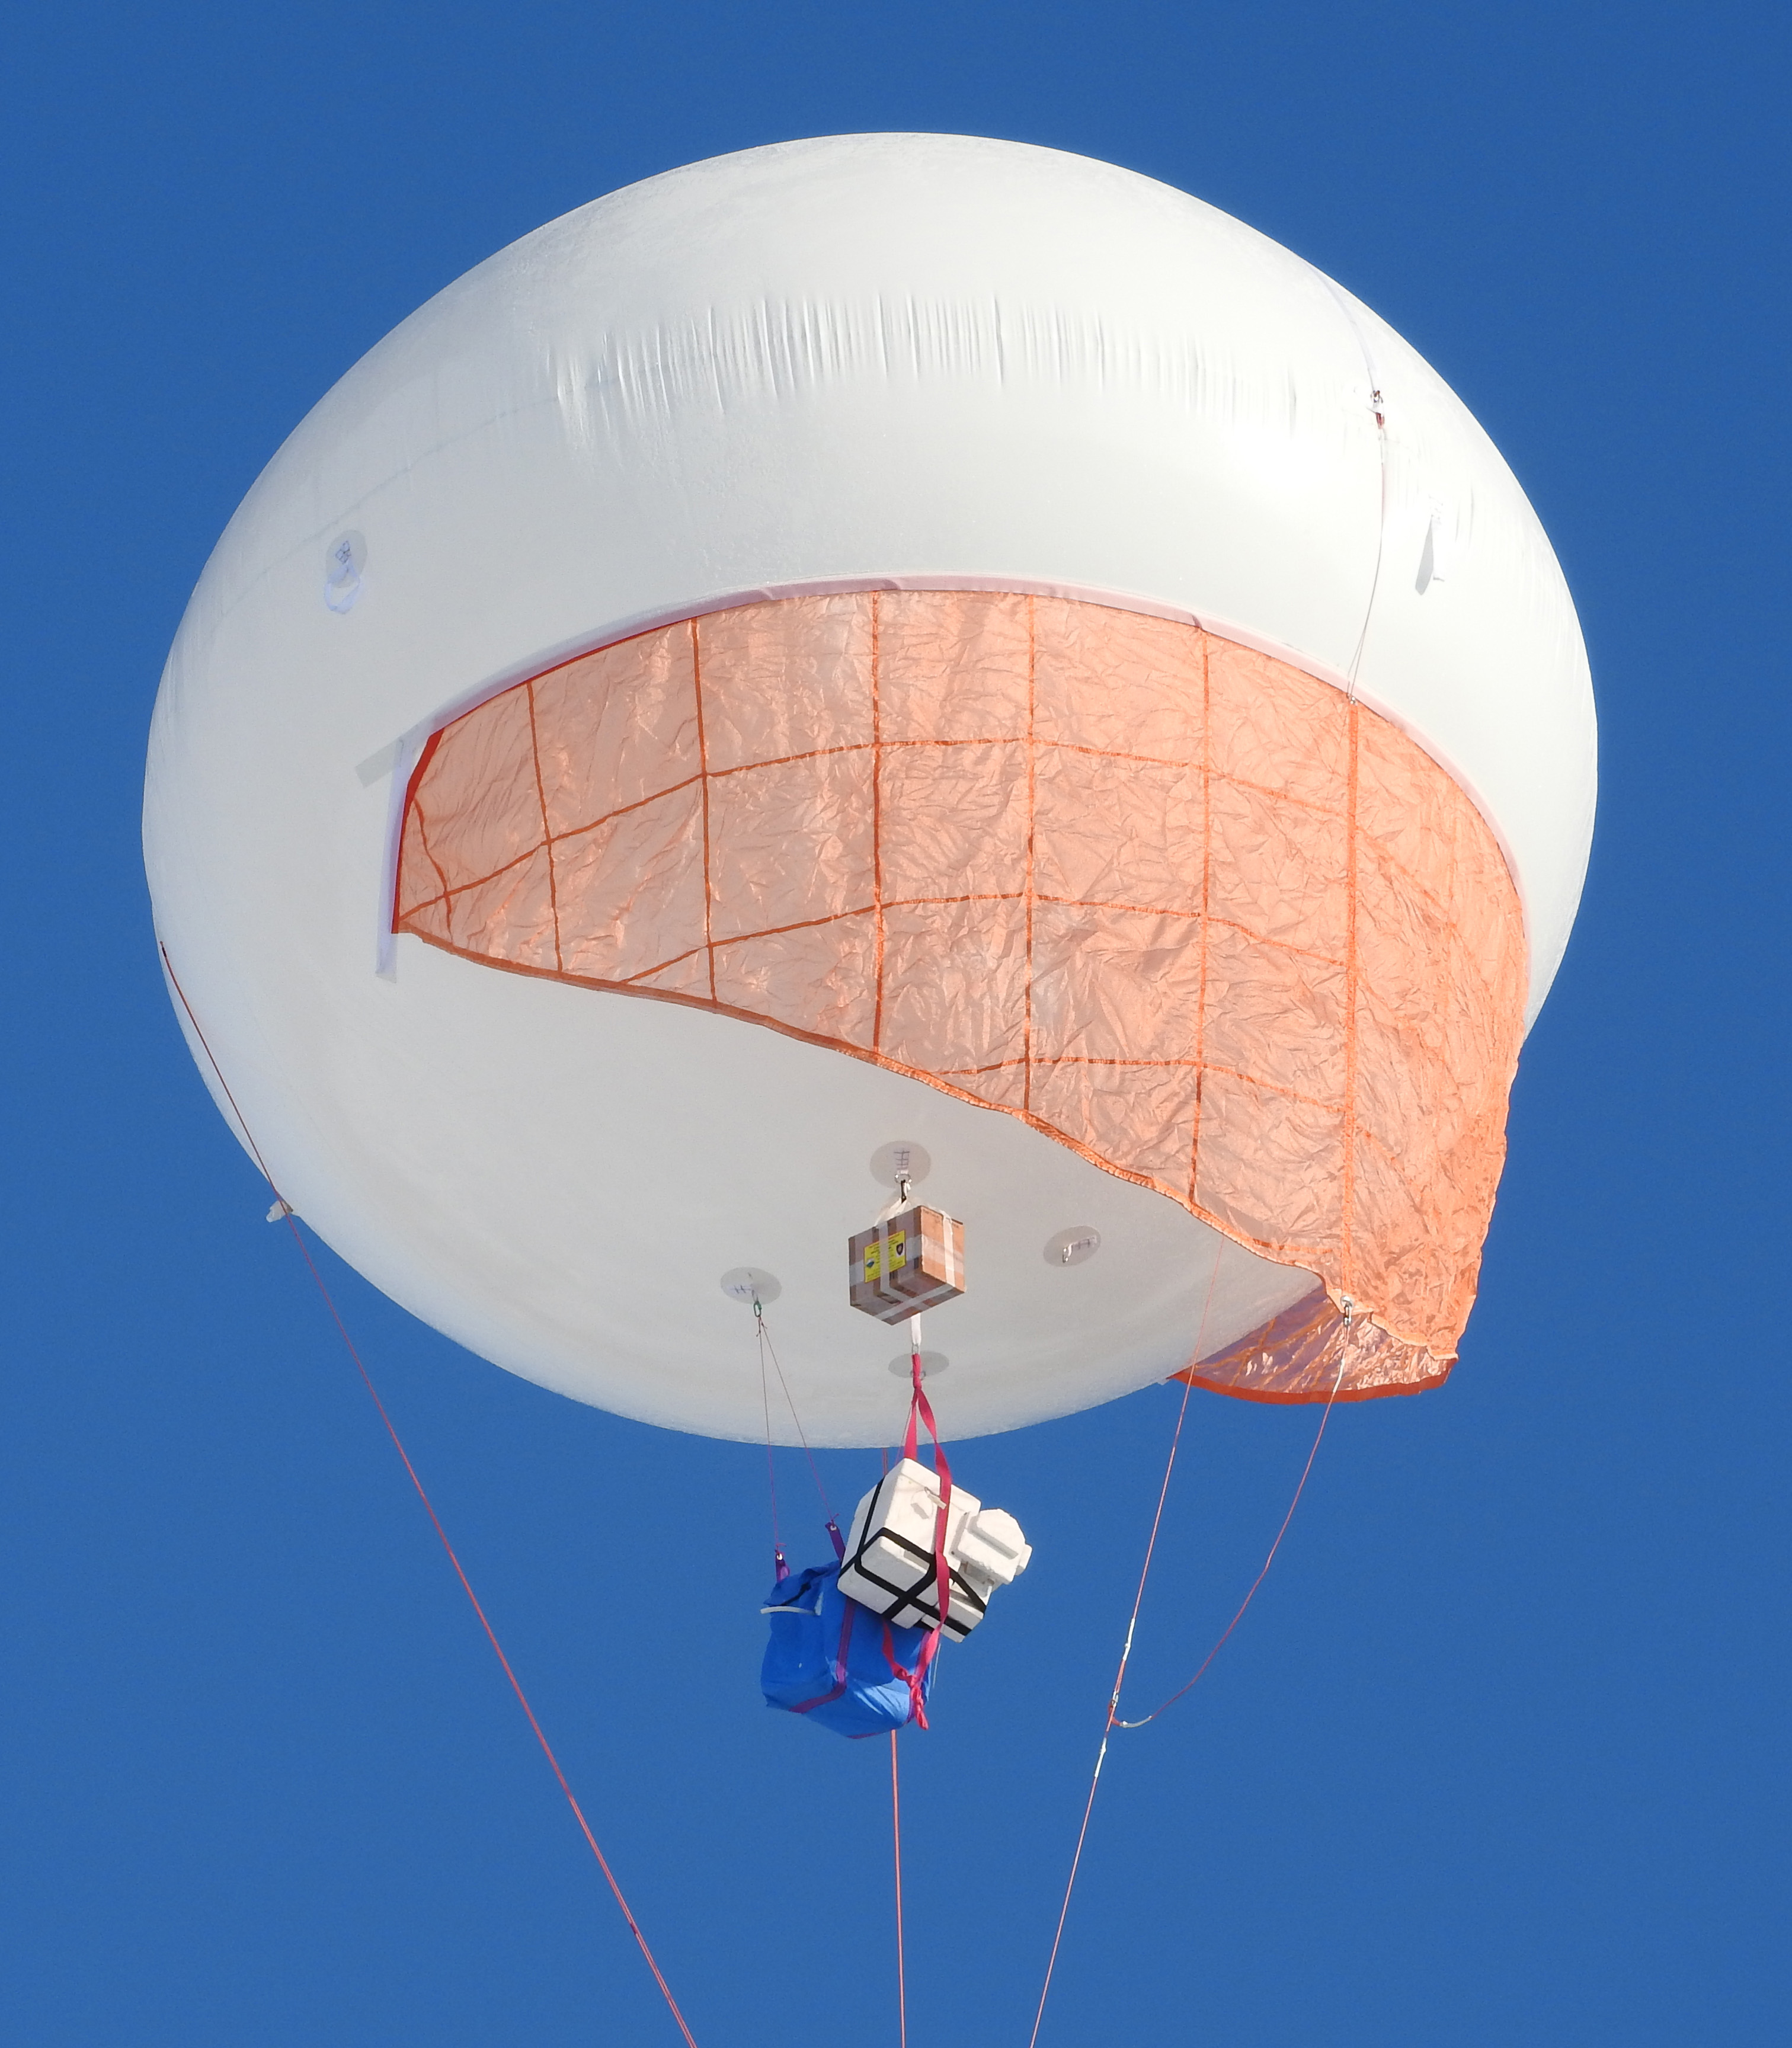
Below: Aerostat with payload deployed in flight. We spend a lot of time looking up. Partly this is to monitor the stability of the flight and partly it is to keep an eye open for any low flying aircraft. The aerostat is 100 feet AGL (about 10 stories high) and there is almost zero wind, as you can tell from the flag at 50 feet hanging limp. Personnel, L-R: John Sohl, Johnny Nikoloff, Michael Hess.
Below: Close up of the payload under the aerostat during flight operations. The blue box is the WSU designed AtmoSniffer, the white box is a standard NOAA ozonesonde/radiosonde pair, and the brown box is the six-channel particle counter/detector.
Below: Johnny Nikoloff inspecting the three instruments being deployed prior to flight. Note the little silver and black can with a hose. This is an ozone destroying filter to allow us to have a zero reference point prior to each flight.
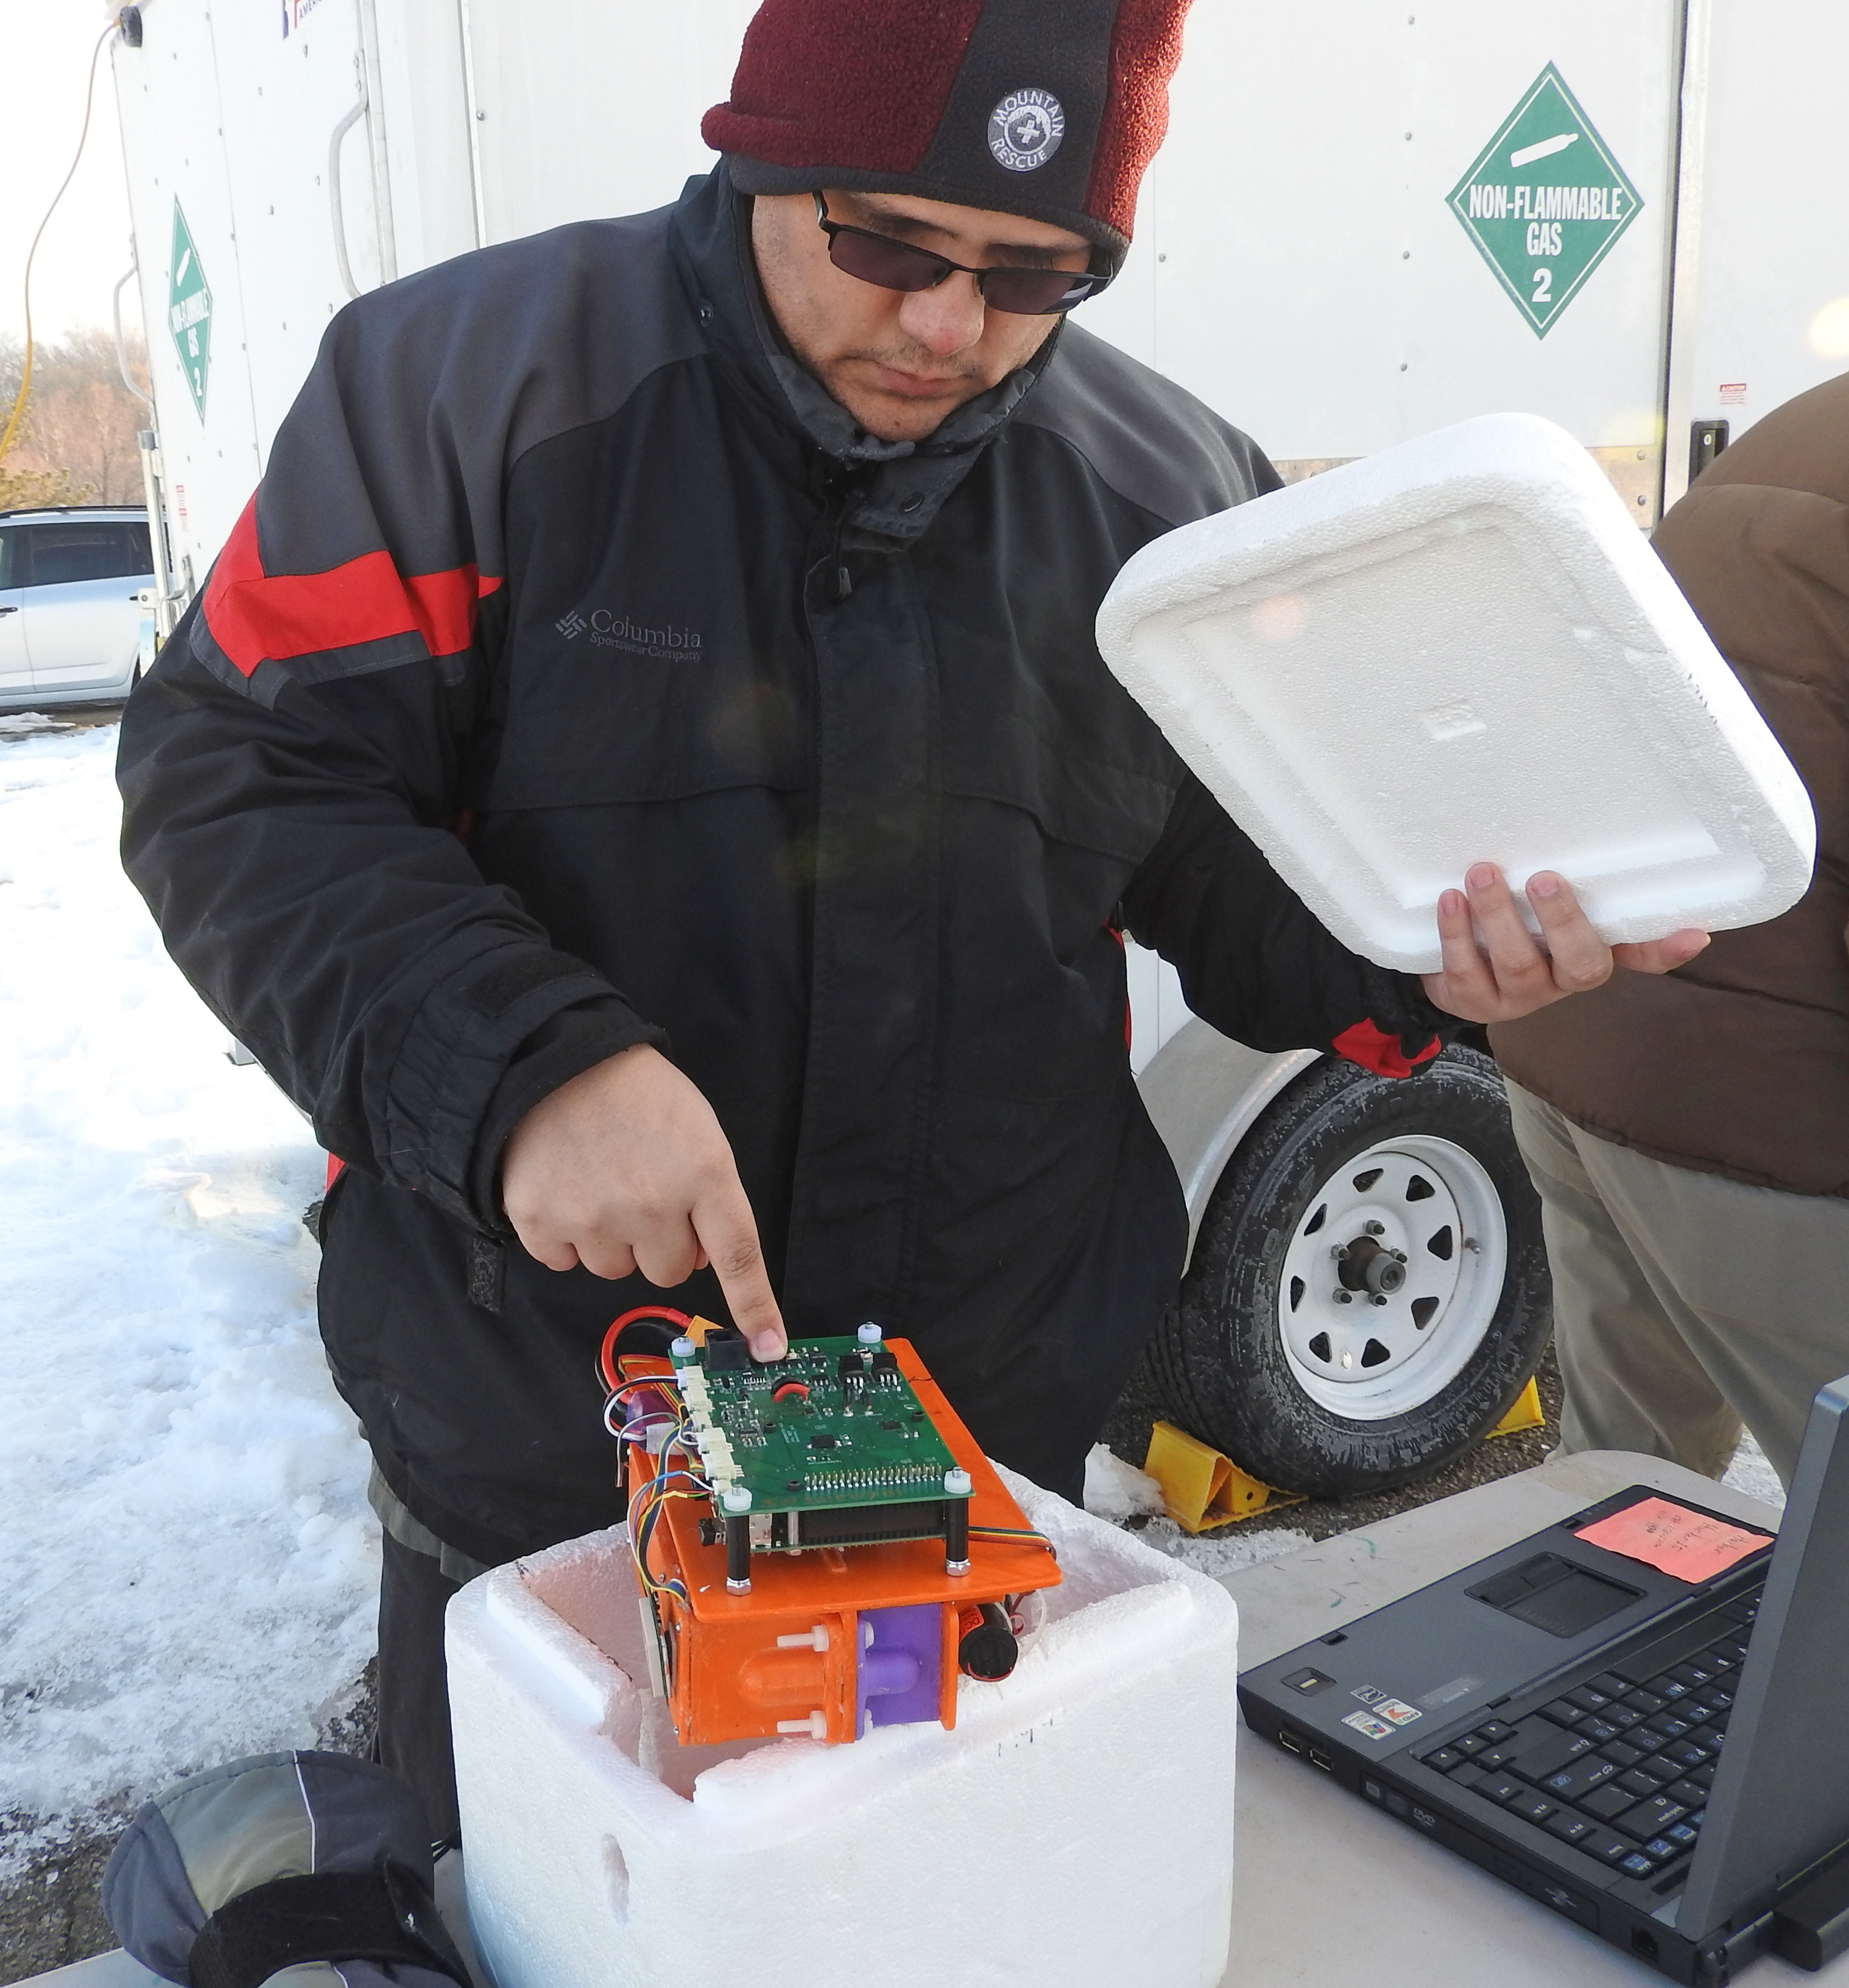
Below: Instruments need to be initialized before each flight. Here the WSU Physics/EE designed AtmoSniffer is being started and initiallized. The AtmoSniffer is completely designed and assembled by undergraduate students at WSU, including 3D printing the housings. Personnel: Michael Hess.
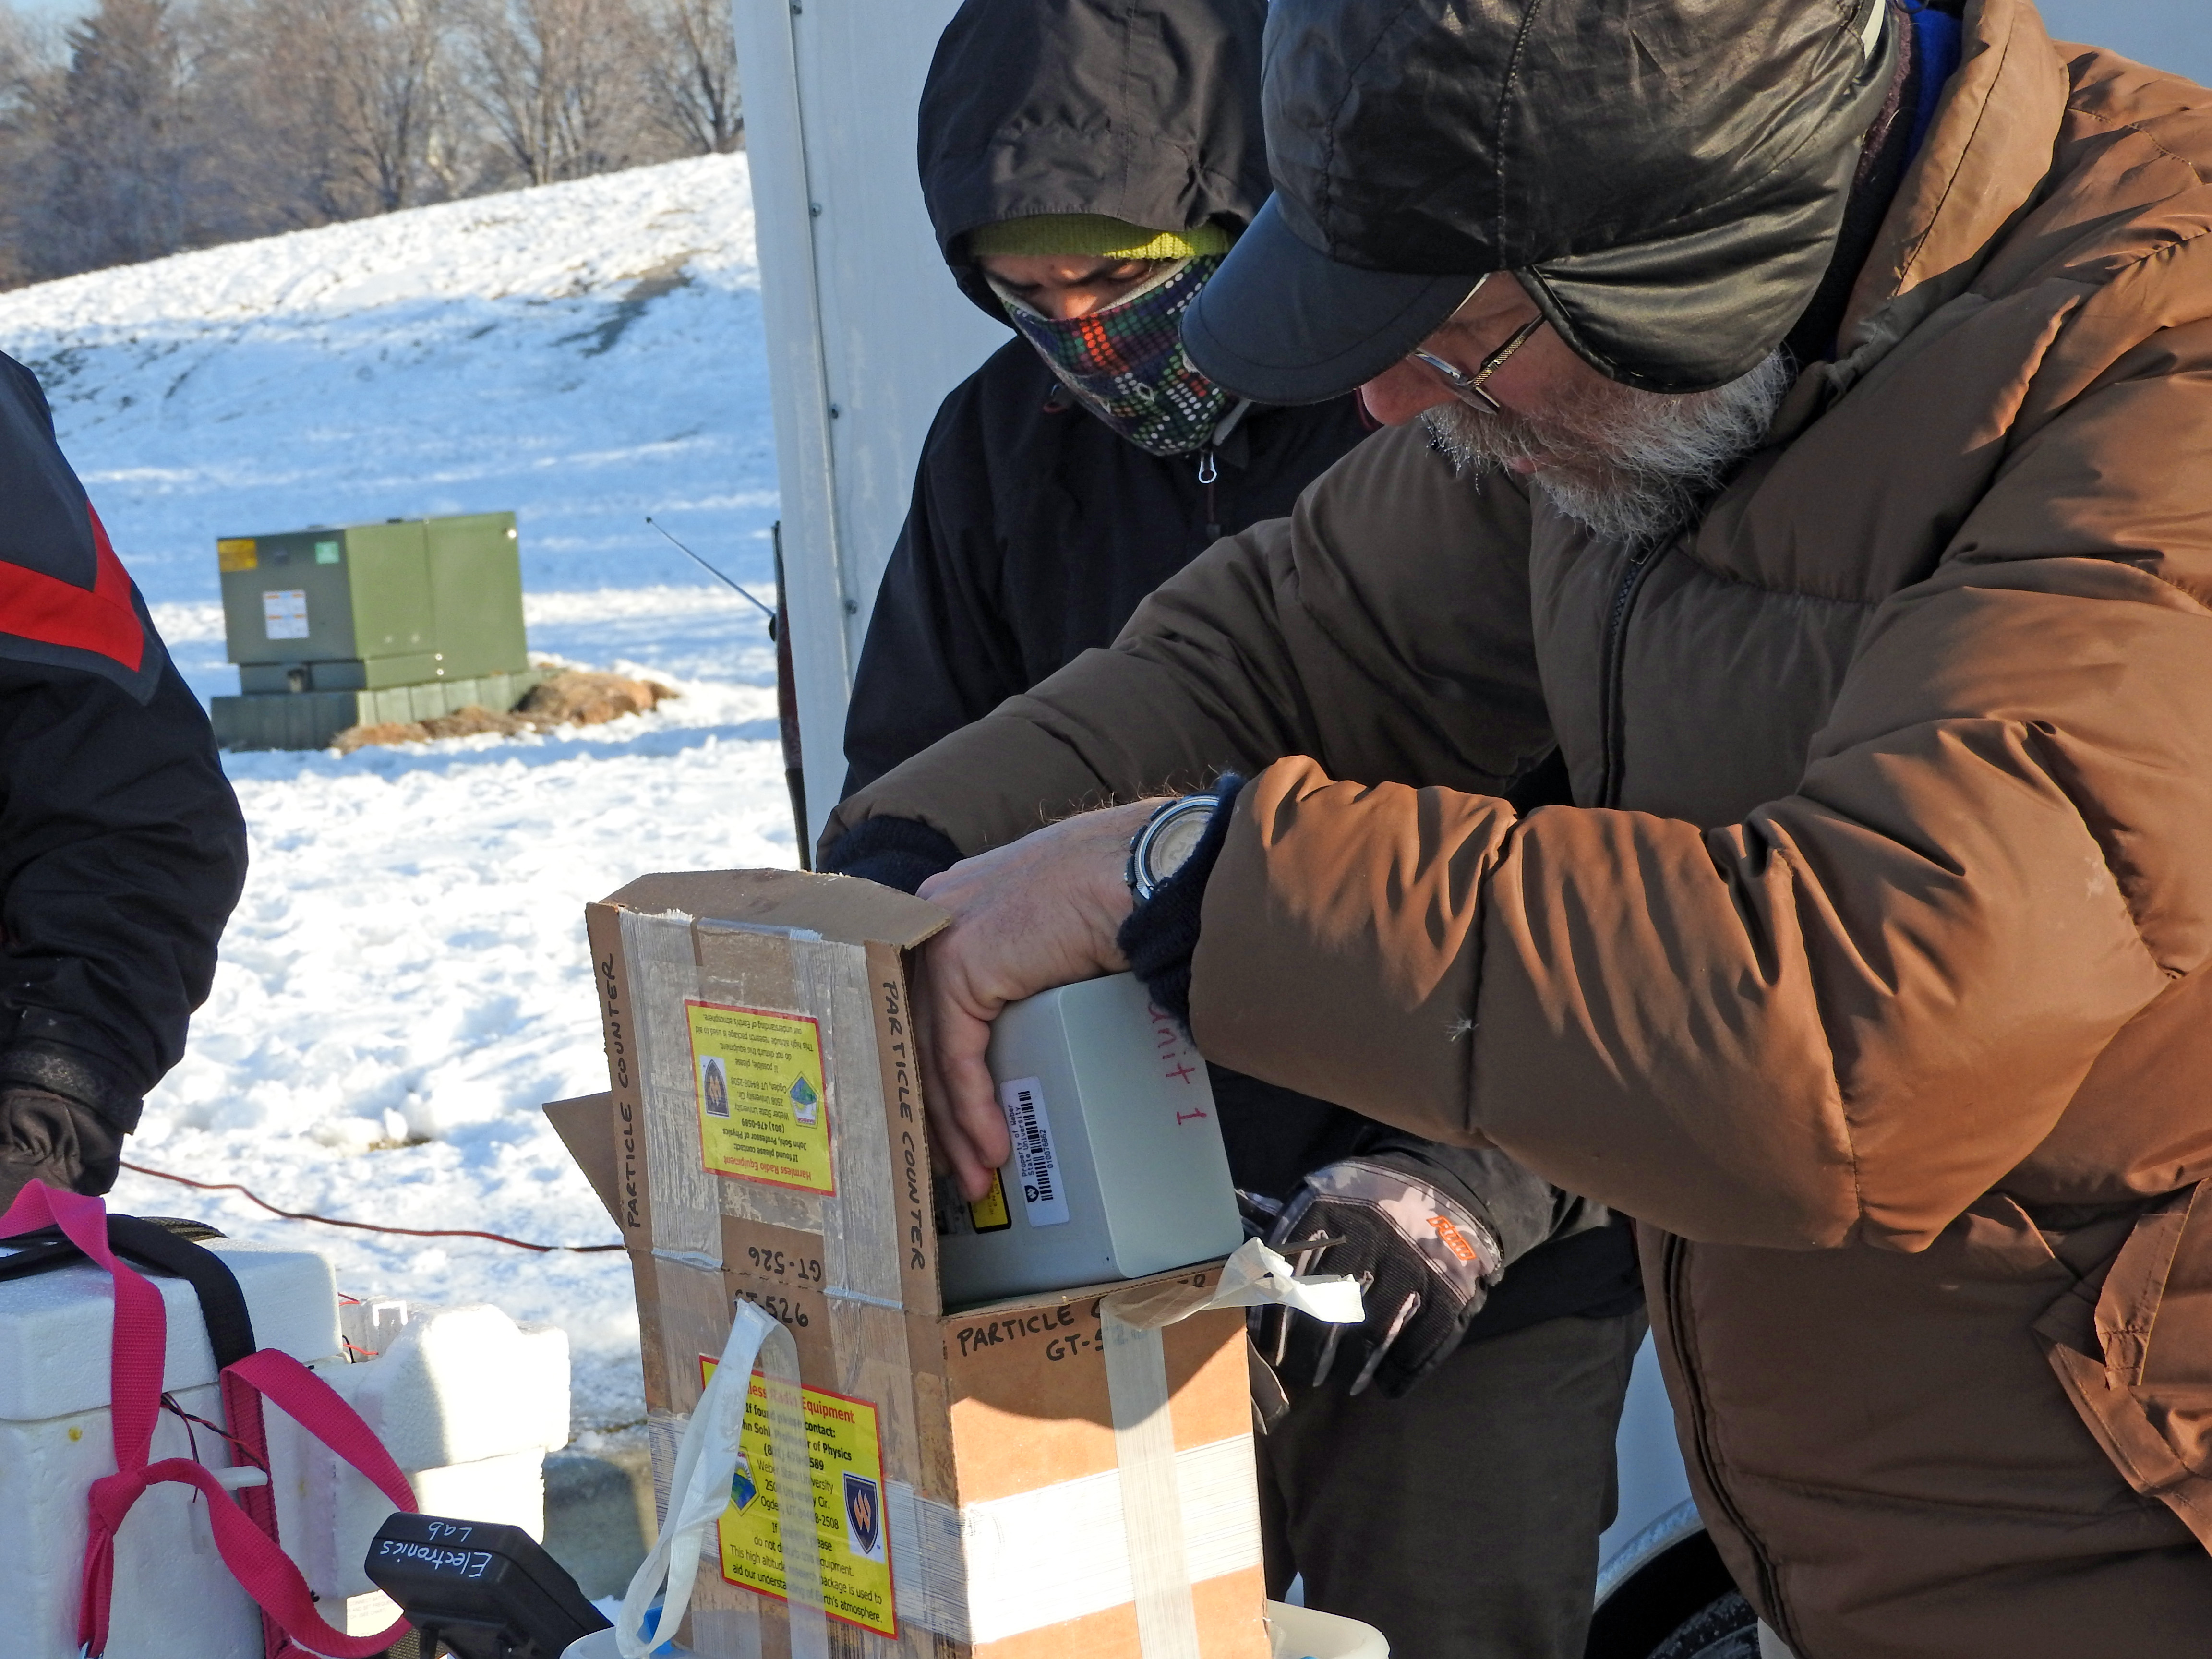
Below: The "HiSAM" particle counter is being loaded in the flight box for deployment. This is a six-channel particulate counter (Metone GT-526). The original HiSAM program is "High-altitude Stratospheric Aerosol Measurement". When this equipment isn't measuring ground level polution it is being sent to the edge of space under a high-altitude weather balloon.) Personnel: Johnny Nikoloff (in mask), John Sohl (loading instrument).
-----------------------
Next we have the initial data from the January 28, 2016 flights.
-----------------------
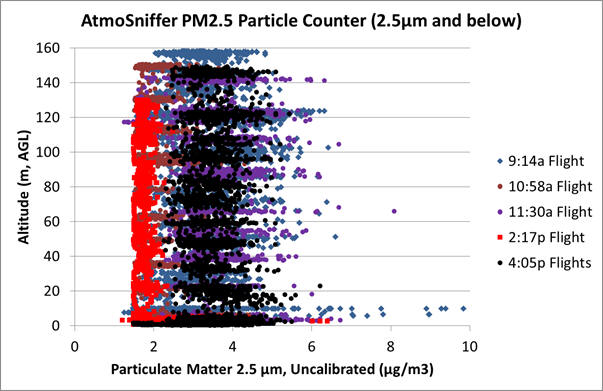
Preliminary data analysis for the winter inversion event as
measured on January 28, 2016. Two important notes: The sensors on the
AtmoSniffer were not zeroed out before flights and the calibration has not been
applied (in fact, we are going to redo the calibration run).
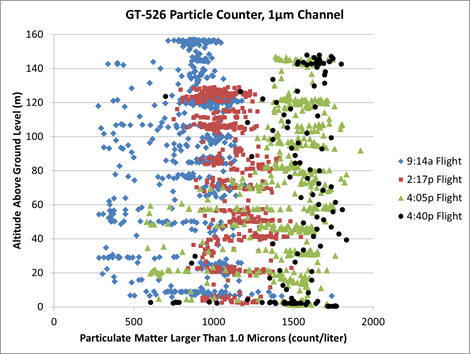
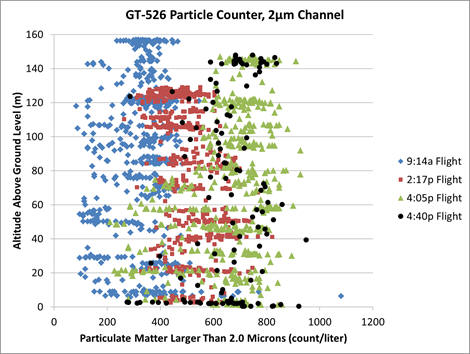
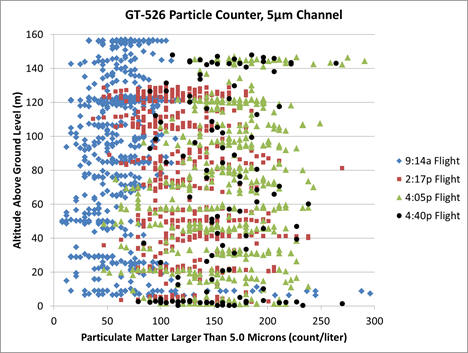
This counts particulates in a fundamentally different way
from the GT-526. For the AtmoSniffer there is a filter (impactor) at the
frontend that removes all particles larger than a certain size. In this case the
particles larger than 2.5μm in diameter are removed by the impactor. The
AtmoSniffer then uses light scattering (in a similar way to the GT-526) to count
everything that gets past the impactor. That is, the AtmoSniffer measures all
particles
smaller than 2.5μm.
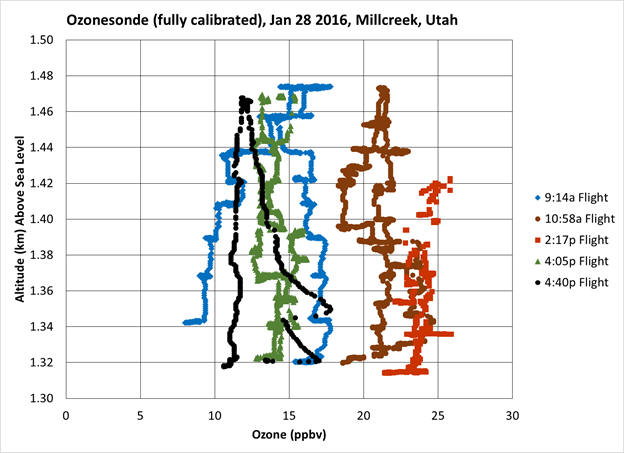
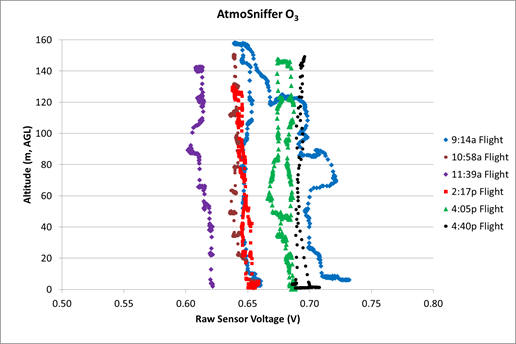
Ozone undergoes the well-known daily
increase that follows the Sun: less in the morning, more mid-day, then less in
the late afternoon. It is reasonably constant vertically.
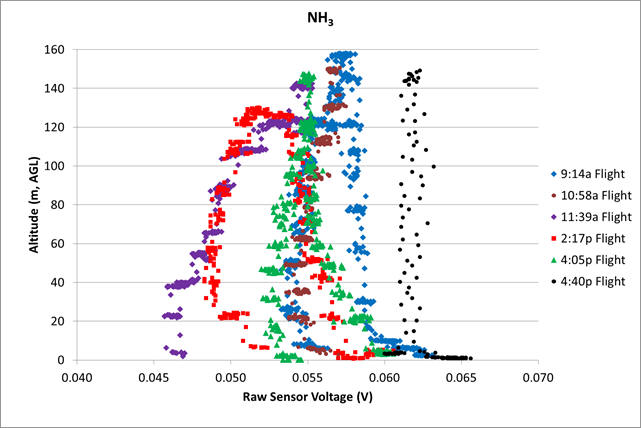
Ammonia
The ammonia levels do evolve over the day. Ammonia starts
out reasonably uniform in the vertical column. In the middle of the day the
levels change quite a bit with altitude and evolve in time. By late afternoon
the ammonia levels become uniform again in the vertical profile.
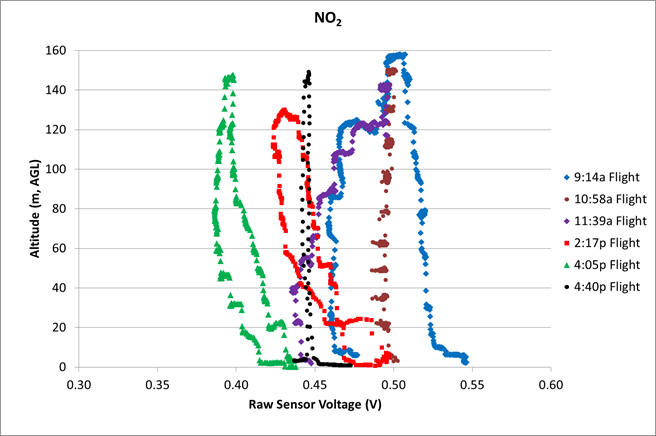
Nitrogen dioxide changes over the course of the day, but is
reasonably uniform vertically at any one time. The main exception is the morning
when the NO2 levels are changing the fastest.
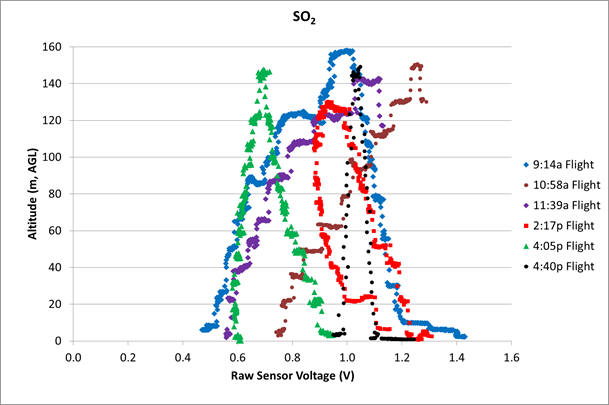
Sulfur dioxide seems to change with altitude in the mornings and becomes more
stable in the afternoon.
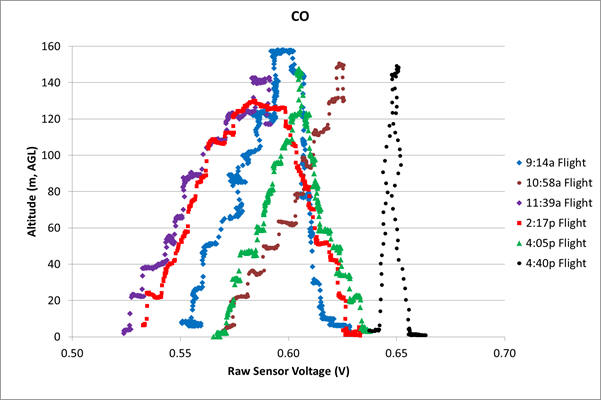
The carbon monoxide readings look too symmetric for each
flight. This makes me suspect of this sensor and that it needs more calibration.
Here are the results from flight (again, smaller voltage = higher
concentration):